Unlock a world of possibilities! Login now and discover the exclusive benefits awaiting you.
- Qlik Community
- :
- Forums
- :
- Analytics
- :
- New to Qlik Analytics
- :
- Re: If Statement with AutoCalendar field
- Subscribe to RSS Feed
- Mark Topic as New
- Mark Topic as Read
- Float this Topic for Current User
- Bookmark
- Subscribe
- Mute
- Printer Friendly Page
- Mark as New
- Bookmark
- Subscribe
- Mute
- Subscribe to RSS Feed
- Permalink
- Report Inappropriate Content
If Statement with AutoCalendar field
I am trying to show both year and month with the following statement:
if(year([first_paymnt_date.autoCalendar.YearMonth])<=2014,'',year([first_paymnt_date.autoCalendar.YearMonth]))
Any suggestions of how to combine year and moth?
Thanks
- Mark as New
- Bookmark
- Subscribe
- Mute
- Subscribe to RSS Feed
- Permalink
- Report Inappropriate Content
I believe this field [first_paymnt_date.autoCalendar.YearMonth] is your date field then take Year, Month from this field like
Year([first_paymnt_date.autoCalendar.YearMonth])
Month([first_paymnt_date.autoCalendar.YearMonth])
=if(year([first_paymnt_date.autoCalendar.YearMonth]) <= 2014,'',year([first_paymnt_date.autoCalendar.YearMonth]) &Month([first_paymnt_date.autoCalendar.YearMonth]))
- Mark as New
- Bookmark
- Subscribe
- Mute
- Subscribe to RSS Feed
- Permalink
- Report Inappropriate Content
Great code, but one problem. At the beginning of my series I have out of phase calculation. I have filter by year and for every year the line graph starts at an unusual peak. Not sure there is some additive function in the calculation. I read somewhere that the autoCalendar is a little buggy. I am attaching the pic.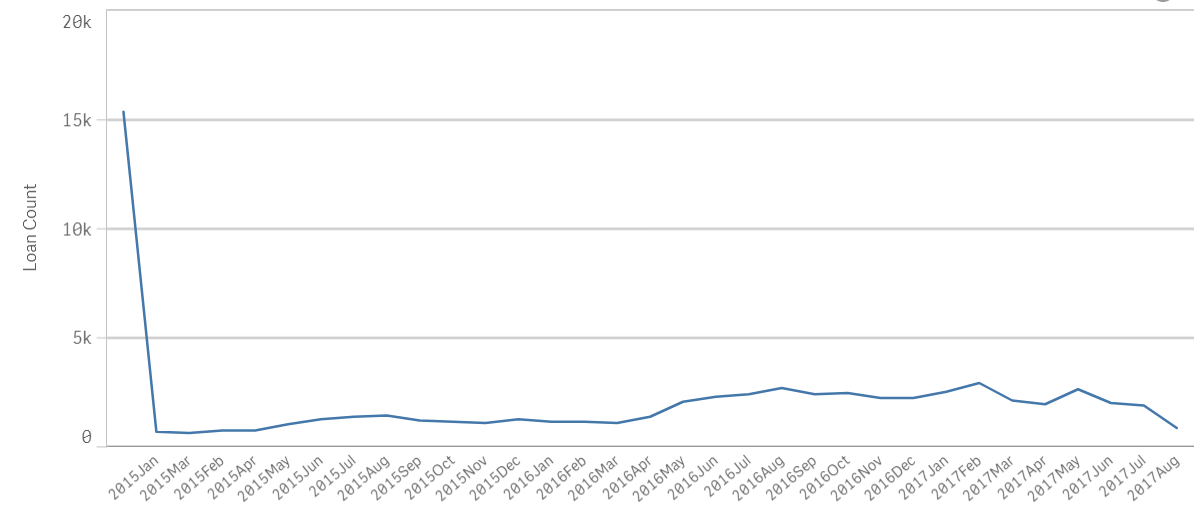
- Mark as New
- Bookmark
- Subscribe
- Mute
- Subscribe to RSS Feed
- Permalink
- Report Inappropriate Content
I didn't here about the autoCalendar there might be Master calendar though.
- Mark as New
- Bookmark
- Subscribe
- Mute
- Subscribe to RSS Feed
- Permalink
- Report Inappropriate Content
One more way is
=if(year([first_paymnt_date.autoCalendar.YearMonth]) <= 2014,'',year([first_paymnt_date.autoCalendar.YearMonth]) &'-'&Month([first_paymnt_date.autoCalendar.YearMonth]))
- Mark as New
- Bookmark
- Subscribe
- Mute
- Subscribe to RSS Feed
- Permalink
- Report Inappropriate Content
Thanks, I found my error in my measure it was counting the Nulls and blanks.
- Mark as New
- Bookmark
- Subscribe
- Mute
- Subscribe to RSS Feed
- Permalink
- Report Inappropriate Content
Good One
- Mark as New
- Bookmark
- Subscribe
- Mute
- Subscribe to RSS Feed
- Permalink
- Report Inappropriate Content
You can close the thread now with appropriate answers.