Unlock a world of possibilities! Login now and discover the exclusive benefits awaiting you.
- Qlik Community
- :
- Forums
- :
- Analytics
- :
- New to Qlik Analytics
- :
- Size of bubbles in scatter plot
- Subscribe to RSS Feed
- Mark Topic as New
- Mark Topic as Read
- Float this Topic for Current User
- Bookmark
- Subscribe
- Mute
- Printer Friendly Page
- Mark as New
- Bookmark
- Subscribe
- Mute
- Subscribe to RSS Feed
- Permalink
- Report Inappropriate Content
Size of bubbles in scatter plot
Is it somehow possible to create a scatter plot as a bubble chart with the size of the bubles depending on a value.
The solution has to be working on Qlik Cloud so using an extension is not an option.
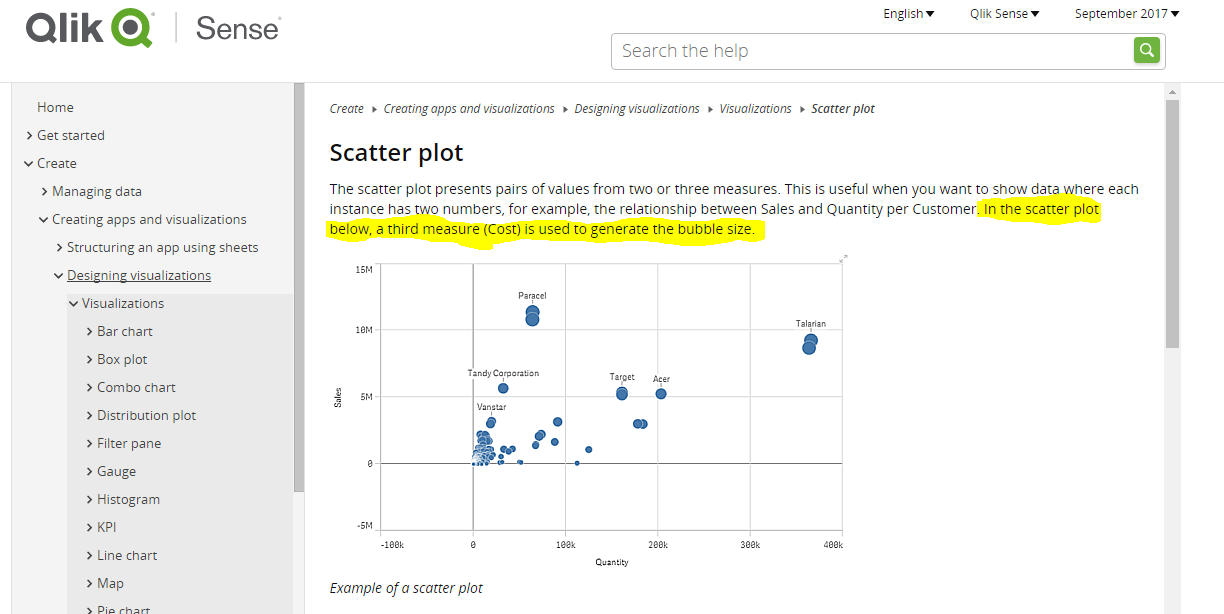
I have found this but not sure how it works:
Accepted Solutions
- Mark as New
- Bookmark
- Subscribe
- Mute
- Subscribe to RSS Feed
- Permalink
- Report Inappropriate Content
Hello,
you use 3 measure :
first measure calculates the x axis
the second measure calculates the y axis
the third calculates the size of the bubble
hope it helps,
Andrei
- Mark as New
- Bookmark
- Subscribe
- Mute
- Subscribe to RSS Feed
- Permalink
- Report Inappropriate Content
From Chart Options select Scatter Plot,
Add Dimension and 2 Measures.
Now If you want to change bubble size according to your 1sr Measure then use same Expression again as 3rd Expression.
In this case your bubble size will change according to Value of that Measure.
- Mark as New
- Bookmark
- Subscribe
- Mute
- Subscribe to RSS Feed
- Permalink
- Report Inappropriate Content
I'm not sure I understand you.
I like to have 1st measure (x axis) and 2nd measue (y axis).
Then the size of the buble is a 3rd measure (have nothing to do with 1st or 2nd measure.
- Mark as New
- Bookmark
- Subscribe
- Mute
- Subscribe to RSS Feed
- Permalink
- Report Inappropriate Content
you have to use a calculated dimension for the 1st measure (x axis).
- Mark as New
- Bookmark
- Subscribe
- Mute
- Subscribe to RSS Feed
- Permalink
- Report Inappropriate Content
Hi Kenneth,
In the properties panel, under measures, you'll notice the first listed measure corresponds to the x-axis. The second measure will correspond to the y-axis. The third measure you add will correspond with the bubble size. Does this help?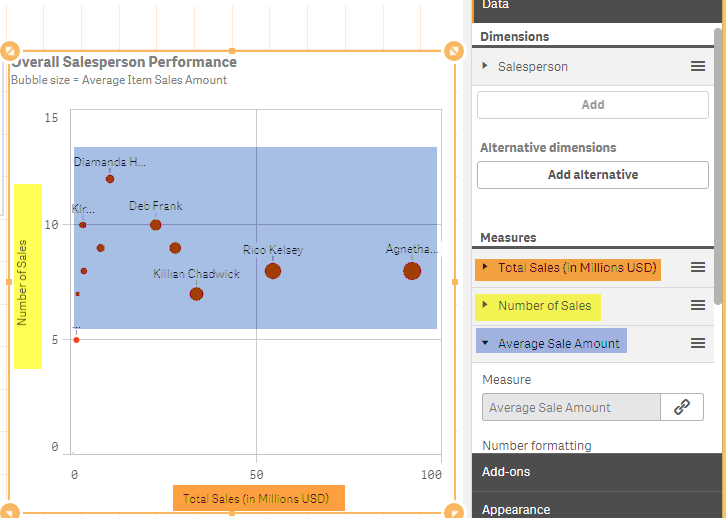
- Mark as New
- Bookmark
- Subscribe
- Mute
- Subscribe to RSS Feed
- Permalink
- Report Inappropriate Content
Hello,
you use 3 measure :
first measure calculates the x axis
the second measure calculates the y axis
the third calculates the size of the bubble
hope it helps,
Andrei