Unlock a world of possibilities! Login now and discover the exclusive benefits awaiting you.
- Qlik Community
- :
- Forums
- :
- Analytics
- :
- New to Qlik Analytics
- :
- Re: how to create an if statement measure in table
- Subscribe to RSS Feed
- Mark Topic as New
- Mark Topic as Read
- Float this Topic for Current User
- Bookmark
- Subscribe
- Mute
- Printer Friendly Page
- Mark as New
- Bookmark
- Subscribe
- Mute
- Subscribe to RSS Feed
- Permalink
- Report Inappropriate Content
how to create an if statement measure in table
I currently have a report that I create in Excel using a Pivot Table. I use a very long if statement in order to calculate the productivity percentile using 4 columns in the pivot. (The if statement calculates outside of the pivot table.) Is there a way to add a measure in a Pivot Table in Qlik Sense that will allow me to use the if statement?
I have added an example of what I'm trying to recreate in Qlik (if you "drill down" in the pivot, the "measure" changes.)
- « Previous Replies
-
- 1
- 2
- Next Replies »
Accepted Solutions
- Mark as New
- Bookmark
- Subscribe
- Mute
- Subscribe to RSS Feed
- Permalink
- Report Inappropriate Content
Hi Shannon,
Remember:
- Dimensionality represents the level of summarisation for your table with 0 being at whole total level, 1 the next level, 2 the following level and so on. When we discussed the State and Practitioner there was only two levels and no total. It's important to fix the levels. If you have more levels you need more IF conditions or a Pick function
- The last formula you posted is incorrect. The first part of the formula when Dimensionality() = 1 is correct but not the second part, you seem to have changed the algorithm, missed functions and parentheses. you need to make sure the formula is OK is your expression editor
For the time being, please paste this formula in a table with County and Practioner
If(Dimensionality() =1,
sum(
IF(Aggr(Sum(rp12),County)<=Aggr(Sum(ecg_25),County),(((Aggr(Sum(rp12),County)-Aggr(Sum(ecg_25),County))/(Aggr(Sum(ecg_25),County))*0.25)+0.25),IF(Aggr(Sum(rp12),County)>Aggr(Sum(ecg_25),County),IF(Aggr(Sum(rp12),County)<=Aggr(Sum(median),County),((Aggr(Sum(rp12),County)-Aggr(Sum(median),County))/(Aggr(Sum(median),County)-Aggr(Sum(ecg_25),County))*0.25+0.5),IF(Aggr(Sum(rp12),County)>Aggr(Sum(median),County),IF(Aggr(Sum(rp12),County)<=Aggr(Sum(ecg_75),County),(((Aggr(Sum(rp12),County)-Aggr(Sum(ecg_75),County))/(Aggr(Sum(ecg_75),County)-Aggr(Sum(median),County))*0.25)+0.75),IF(Aggr(Sum(rp12),County)>Aggr(Sum(ecg_75),County),IF(Aggr(Sum(rp12),County)<=Aggr(Sum(ecg_90),County),(((Aggr(Sum(rp12),County)-Aggr(Sum(ecg_90),County))/(Aggr(Sum(ecg_90),County)-Aggr(Sum(ecg_75),County))*0.15)+0.9),(((Aggr(Sum(rp12),County)-Aggr(Sum(ecg_90),County))/Aggr(Sum(ecg_90),County))+0.9))))))))
),
sum(
IF(rp12<=ecg_25,(((rp12-ecg_25)/(ecg_25)*0.25)+0.25),IF(rp12>ecg_25,IF(rp12<=median,((rp12-median)/(median-ecg_25)*0.25+0.5),IF(rp12>median,IF(rp12<=ecg_75,(((rp12-ecg_75)/(ecg_75-median)*0.25)+0.75),IF(rp12>ecg_75,IF(rp12<=ecg_90,(((rp12-ecg_90)/(ecg_90-ecg_75)*0.15)+0.9),(((rp12-ecg_90)/ecg_90)+0.9))))))))
)
)
If you want, see if it's required for you to disguise your data and send me your qvf so I could help you better.
I hope this helps,
Cheers,
Luis
PS. When applicable please mark the appropriate replies as Correct. This will help community members know which discussions have already been addressed and have a possible known solution. Please mark replies as Helpful if the provided solution is helpful to the problem, but does not necessarily solve the indicated problem. You can mark
- Mark as New
- Bookmark
- Subscribe
- Mute
- Subscribe to RSS Feed
- Permalink
- Report Inappropriate Content
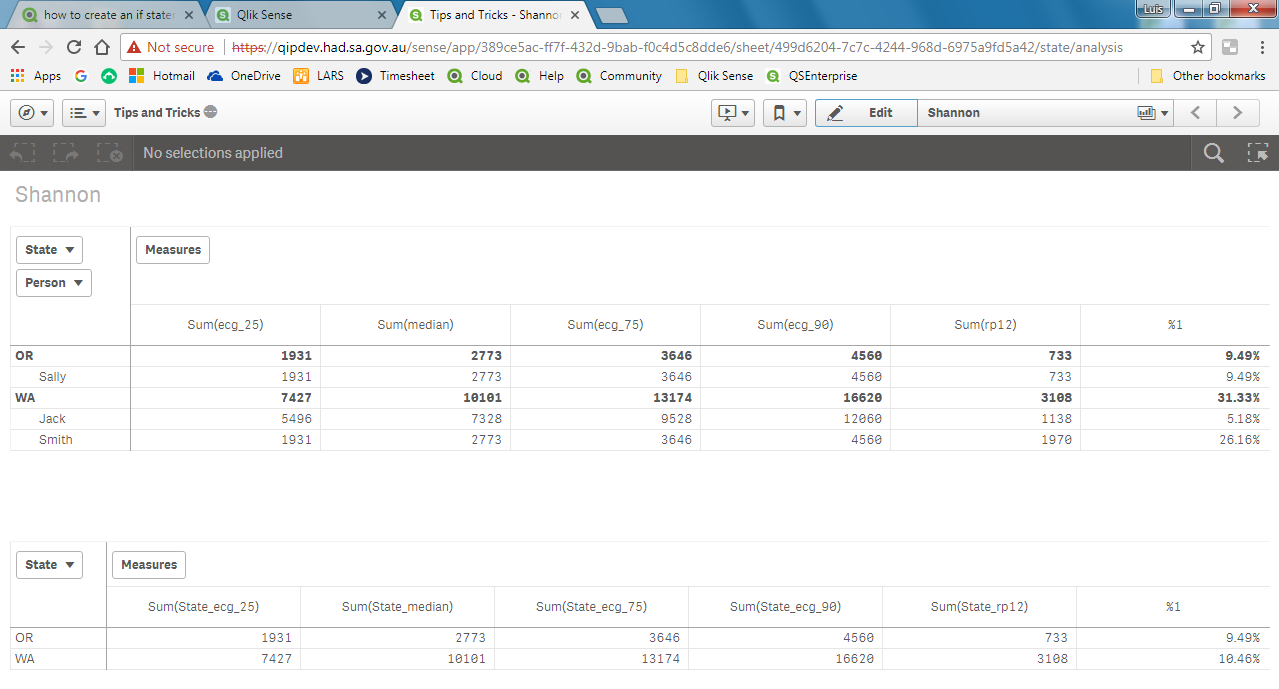
Sorry Shannon, I gave it a go but couldn't do it without summarising the States in another table
Detail:
LOAD
Person,
State,
"Store",
ecg_25,
"median",
ecg_75,
ecg_90,
rp12,
Annualized
FROM [lib://AttachedFiles/Data.xlsx]
(ooxml, embedded labels, table is Sheet1);
Summary:
Load
State,
Sum(ecg_25) as State_ecg_25,
Sum("median") as State_median,
Sum(ecg_75) as State_ecg_75,
Sum(ecg_90) as State_ecg_90,
Sum(rp12) as State_rp12
resident Detail
group by State;
This is the Measure for People
sum(
IF(rp12<=ecg_25,(((rp12-ecg_25)/(ecg_25)*0.25)+0.25),IF(rp12>ecg_25,IF(rp12<=median,((rp12-median)/(median-ecg_25)*0.25+0.5),IF(rp12>median,IF(rp12<=ecg_75,(((rp12-ecg_75)/(ecg_75-median)*0.25)+0.75),IF(rp12>ecg_75,IF(rp12<=ecg_90,(((rp12-ecg_90)/(ecg_90-ecg_75)*0.15)+0.9),(((rp12-ecg_90)/ecg_90)+0.9))))))))
)
This is the Measure for States (2nd pivot table)
sum(
IF(State_rp12<=State_ecg_25,(((State_rp12-State_ecg_25)/(State_ecg_25)*0.25)+0.25),IF(State_rp12>State_ecg_25,IF(State_rp12<=State_median,((State_rp12-State_median)/(State_median-State_ecg_25)*0.25+0.5),IF(State_rp12>State_median,IF(State_rp12<=State_ecg_75,(((State_rp12-State_ecg_75)/(State_ecg_75-State_median)*0.25)+0.75),IF(State_rp12>State_ecg_75,IF(State_rp12<=State_ecg_90,(((State_rp12-State_ecg_90)/(State_ecg_90-State_ecg_75)*0.15)+0.9),(((State_rp12-State_ecg_90)/State_ecg_90)+0.9))))))))
)
The only thing I did was duplicate your If and replace the cell names for the field names
I hope this helps a bit
Cheers,
Luis
- Mark as New
- Bookmark
- Subscribe
- Mute
- Subscribe to RSS Feed
- Permalink
- Report Inappropriate Content
Thanks for trying! This is the very first app I've ever attempted and it's definitely giving me a run for my money. I dumped in your first measure and, at first glance, it appears to have worked. But when I verify the percentiles, they're all over the map. For instance, my first calculation should be (317,290-372,161)/(372,161-273,275)*.25)+.75. It's returning a value of 60.00 (I also need help formatting the expression to return the value as 60.00%. Currently, the format is 0.00). The correct value should be 61.13, which isn't tremendously far off, but the next row should be (799,224-814739)/(814739-632687)*.25)+.50. This is returning a value of 88.35. That is really far off from the correct answer of 47.87%.
This is the measurement i have dumped in, which is just copied over from yours:
sum(IF(rp12<=ecg_25,(((rp12-ecg_25)/(ecg_25)*0.25)+0.25),IF(rp12>ecg_25,IF(rp12<=median,((rp12-median)/(median-ecg_25)*0.25+0.5),IF(rp12>median,IF(rp12<=ecg_75,(((rp12-ecg_75)/(ecg_75-median)*0.25)+0.75),IF(rp12>ecg_75,IF(rp12<=ecg_90,(((rp12-ecg_90)/(ecg_90-ecg_75)*0.15)+0.9),(((rp12-ecg_90)/ecg_90)+0.9)))))))))
In case that doesn't make sense, here is a screenshot:

- Mark as New
- Bookmark
- Subscribe
- Mute
- Subscribe to RSS Feed
- Permalink
- Report Inappropriate Content
After playing with it, the issue I was having below with the IF statement is the "sum()" function. If I remove the "sum" part of the IF statement, it gives me empty values until i drill completely down to the last level in the drill and then it gives me the correct value. So now I understand why you had the two pivots.
At first glance, your first pivot looked exactly like what I needed as it had the State and Person percentiles. But I thought the entire point of QLIK being drillable was that it could properly calculate as it drilled down and the values changed, so hopefully someone can further help with the IF statement to make this a true statement? It seems odd that it would stop calculating the percentiles in the upper levels of the drill considering I have the same column titles?
- Mark as New
- Bookmark
- Subscribe
- Mute
- Subscribe to RSS Feed
- Permalink
- Report Inappropriate Content
Hi Shannon,
I just learned this thing about Dimensionality this week and I just remembered that we couldn't work out the right way to calculate at the State level. Look now:
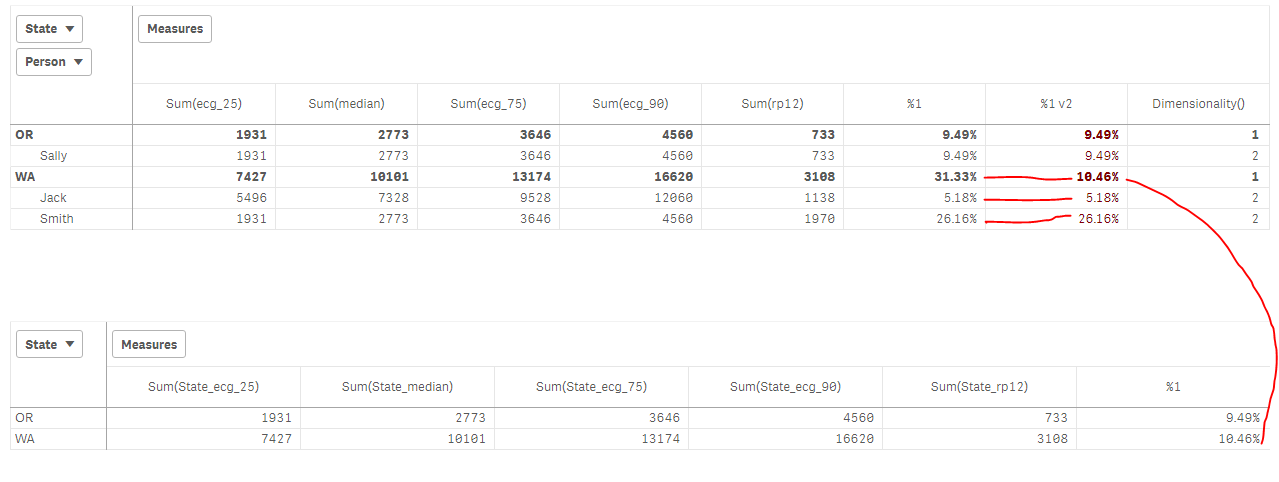
This function Dimensionality() gives you the level at which you're working so you could make a different calculation for that level.
Let me know if you're interested in knowing how to achieve this
Cheers,
Luis
- Mark as New
- Bookmark
- Subscribe
- Mute
- Subscribe to RSS Feed
- Permalink
- Report Inappropriate Content
That looks great! Please teach me your ways!  (knowing that this is my first every Qlik visual so I may be annoyingly needy and confused.
  )
)
-Shannon
- Mark as New
- Bookmark
- Subscribe
- Mute
- Subscribe to RSS Feed
- Permalink
- Report Inappropriate Content
Ok,
Basically
If Dimensionality() = 1
Then Formula aggregating by State
Else Normal formula that you already have
End If
In the normal formula you have values such as rp12; you change it to Aggr(Sum(rp12),State) for State aggregation... and so on with the rest of the values
As this is a big formula, I only did it for the first part of the if:
If(Dimensionality() = 1,
sum(
IF(Aggr(Sum(rp12),State)<=Aggr(Sum(ecg_25),State),(((Aggr(Sum(rp12),State)-Aggr(Sum(ecg_25),State))/(Aggr(Sum(ecg_25),State))*0.25)+0.25),IF(Aggr(Sum(rp12),State)>Aggr(Sum(ecg_25),State),IF(rp12<=median,((Aggr(Sum(rp12),State)-median)/(median-Aggr(Sum(ecg_25),State))*0.25+0.5),IF(Aggr(Sum(rp12),State)>median,IF(Aggr(Sum(rp12),State)<=ecg_75,(((Aggr(Sum(rp12),State)-ecg_75)/(ecg_75-median)*0.25)+0.75),IF(Aggr(Sum(rp12),State)>ecg_75,IF(Aggr(Sum(rp12),State)<=ecg_90,(((Aggr(Sum(rp12),State)-ecg_90)/(ecg_90-ecg_75)*0.15)+0.9),(((Aggr(Sum(rp12),State)-ecg_90)/ecg_90)+0.9))))))))
),
sum(
IF(rp12<=ecg_25,(((rp12-ecg_25)/(ecg_25)*0.25)+0.25),IF(rp12>ecg_25,IF(rp12<=median,((rp12-median)/(median-ecg_25)*0.25+0.5),IF(rp12>median,IF(rp12<=ecg_75,(((rp12-ecg_75)/(ecg_75-median)*0.25)+0.75),IF(rp12>ecg_75,IF(rp12<=ecg_90,(((rp12-ecg_90)/(ecg_90-ecg_75)*0.15)+0.9),(((rp12-ecg_90)/ecg_90)+0.9))))))))
)
)
This also means that if you want to have a different calculation for an overall Total you could use test for Dimensionality() = 0
Happy to discuss,
I hope if works for you,
Cheers,
Luis
- Mark as New
- Bookmark
- Subscribe
- Mute
- Subscribe to RSS Feed
- Permalink
- Report Inappropriate Content
Thank you so much. Sorry to be so difficult, but I'm not sure what I'm doing wrong. I attempted to translate your expression for my actual table where I have the following drills: 1) County, 2) Service Line, 3) Specialty, 4)Practitioner. Because I don't actually have "State" I translated that to "County" with the following expression, but it's no longer giving me any Productivity Percentiles. What I did was create a Master Item with the expression below and dragged it over my existing Pivot Table. I'm not sure where the issue is?
If(Dimensionality() = 1,sum(IF(Aggr(Sum(rp12),County)<=Aggr(Sum(ecg_25),County),(((Aggr(Sum(rp12),County)-Aggr(Sum(ecg_25),County))/(Aggr(Sum(ecg_25),County))*0.25)+0.25),IF(Aggr(Sum(rp12),County)>Aggr(Sum(ecg_25),County),IF(rp12<=median,((Aggr(Sum(rp12),County)-median)/(median-Aggr(Sum(ecg_25),County))*0.25+0.5),IF(Aggr(Sum(rp12),County)>median,IF(Aggr(Sum(rp12),County)<=ecg_75,(((Aggr(Sum(rp12),County)-ecg_75)/(ecg_75-median)*0.25)+0.75),IF(Aggr(Sum(rp12),County)>ecg_75,IF(Aggr(Sum(rp12),County)<=ecg_90,(((Aggr(Sum(rp12),County)-ecg_90)/(ecg_90-ecg_75)*0.15)+0.9),(((Aggr(Sum(rp12),County)-ecg_90)/ecg_90)+0.9))))))))), sum(IF(rp12<=ecg_25,(((rp12-ecg_25)rp12),County)-ecg_90)/(ecg_90-ecg_75)*0.15)+0.9),(((Aggr(Sum(rp12),County)-ecg_90)/ecg_90)+0.9))))))))), sum(IF(rp12<=ecg_25,(((rp12-ecg_25)/(ecg/(ecg_25)*0.25)+0.25),IF(rp12>ecg_25,IF(rp12<=median,((rp12-median)/(median-ecg_25)*0.25+0.5),IF(rp12>median,IF(rp12<=ecg_75,(((rp12-ecg_75)/(ecg_75-median)*0.25)+0.75),IF(rp12>ecg_75,IF(rp12<=ecg_90,(((rp12-ecg_90)/(ecg_90-ecg_75)*0.15)+0.9),(((rp12-ecg_90)/ecg_90)+0.9))))))))))
- Mark as New
- Bookmark
- Subscribe
- Mute
- Subscribe to RSS Feed
- Permalink
- Report Inappropriate Content
This is a view from the last level of the drill (Practitioner):
and the first level of the drill:

- Mark as New
- Bookmark
- Subscribe
- Mute
- Subscribe to RSS Feed
- Permalink
- Report Inappropriate Content
Hi Shannon,
Remember:
- Dimensionality represents the level of summarisation for your table with 0 being at whole total level, 1 the next level, 2 the following level and so on. When we discussed the State and Practitioner there was only two levels and no total. It's important to fix the levels. If you have more levels you need more IF conditions or a Pick function
- The last formula you posted is incorrect. The first part of the formula when Dimensionality() = 1 is correct but not the second part, you seem to have changed the algorithm, missed functions and parentheses. you need to make sure the formula is OK is your expression editor
For the time being, please paste this formula in a table with County and Practioner
If(Dimensionality() =1,
sum(
IF(Aggr(Sum(rp12),County)<=Aggr(Sum(ecg_25),County),(((Aggr(Sum(rp12),County)-Aggr(Sum(ecg_25),County))/(Aggr(Sum(ecg_25),County))*0.25)+0.25),IF(Aggr(Sum(rp12),County)>Aggr(Sum(ecg_25),County),IF(Aggr(Sum(rp12),County)<=Aggr(Sum(median),County),((Aggr(Sum(rp12),County)-Aggr(Sum(median),County))/(Aggr(Sum(median),County)-Aggr(Sum(ecg_25),County))*0.25+0.5),IF(Aggr(Sum(rp12),County)>Aggr(Sum(median),County),IF(Aggr(Sum(rp12),County)<=Aggr(Sum(ecg_75),County),(((Aggr(Sum(rp12),County)-Aggr(Sum(ecg_75),County))/(Aggr(Sum(ecg_75),County)-Aggr(Sum(median),County))*0.25)+0.75),IF(Aggr(Sum(rp12),County)>Aggr(Sum(ecg_75),County),IF(Aggr(Sum(rp12),County)<=Aggr(Sum(ecg_90),County),(((Aggr(Sum(rp12),County)-Aggr(Sum(ecg_90),County))/(Aggr(Sum(ecg_90),County)-Aggr(Sum(ecg_75),County))*0.15)+0.9),(((Aggr(Sum(rp12),County)-Aggr(Sum(ecg_90),County))/Aggr(Sum(ecg_90),County))+0.9))))))))
),
sum(
IF(rp12<=ecg_25,(((rp12-ecg_25)/(ecg_25)*0.25)+0.25),IF(rp12>ecg_25,IF(rp12<=median,((rp12-median)/(median-ecg_25)*0.25+0.5),IF(rp12>median,IF(rp12<=ecg_75,(((rp12-ecg_75)/(ecg_75-median)*0.25)+0.75),IF(rp12>ecg_75,IF(rp12<=ecg_90,(((rp12-ecg_90)/(ecg_90-ecg_75)*0.15)+0.9),(((rp12-ecg_90)/ecg_90)+0.9))))))))
)
)
If you want, see if it's required for you to disguise your data and send me your qvf so I could help you better.
I hope this helps,
Cheers,
Luis
PS. When applicable please mark the appropriate replies as Correct. This will help community members know which discussions have already been addressed and have a possible known solution. Please mark replies as Helpful if the provided solution is helpful to the problem, but does not necessarily solve the indicated problem. You can mark
- « Previous Replies
-
- 1
- 2
- Next Replies »