Unlock a world of possibilities! Login now and discover the exclusive benefits awaiting you.
- Qlik Community
- :
- Forums
- :
- Analytics
- :
- New to Qlik Analytics
- :
- Re: A way to show alternative/excluded values
- Subscribe to RSS Feed
- Mark Topic as New
- Mark Topic as Read
- Float this Topic for Current User
- Bookmark
- Subscribe
- Mute
- Printer Friendly Page
- Mark as New
- Bookmark
- Subscribe
- Mute
- Subscribe to RSS Feed
- Permalink
- Report Inappropriate Content
A way to show alternative/excluded values
Hi all,
Is there a way/ a direct function to show the alternative/excluded values?
if I have 4 dates for example, and a field containg 100 values;
if I select date1;
count(Field) will be 80
if I want to show these 80 fields; I'll just have to use ; concat(Field,',') for example
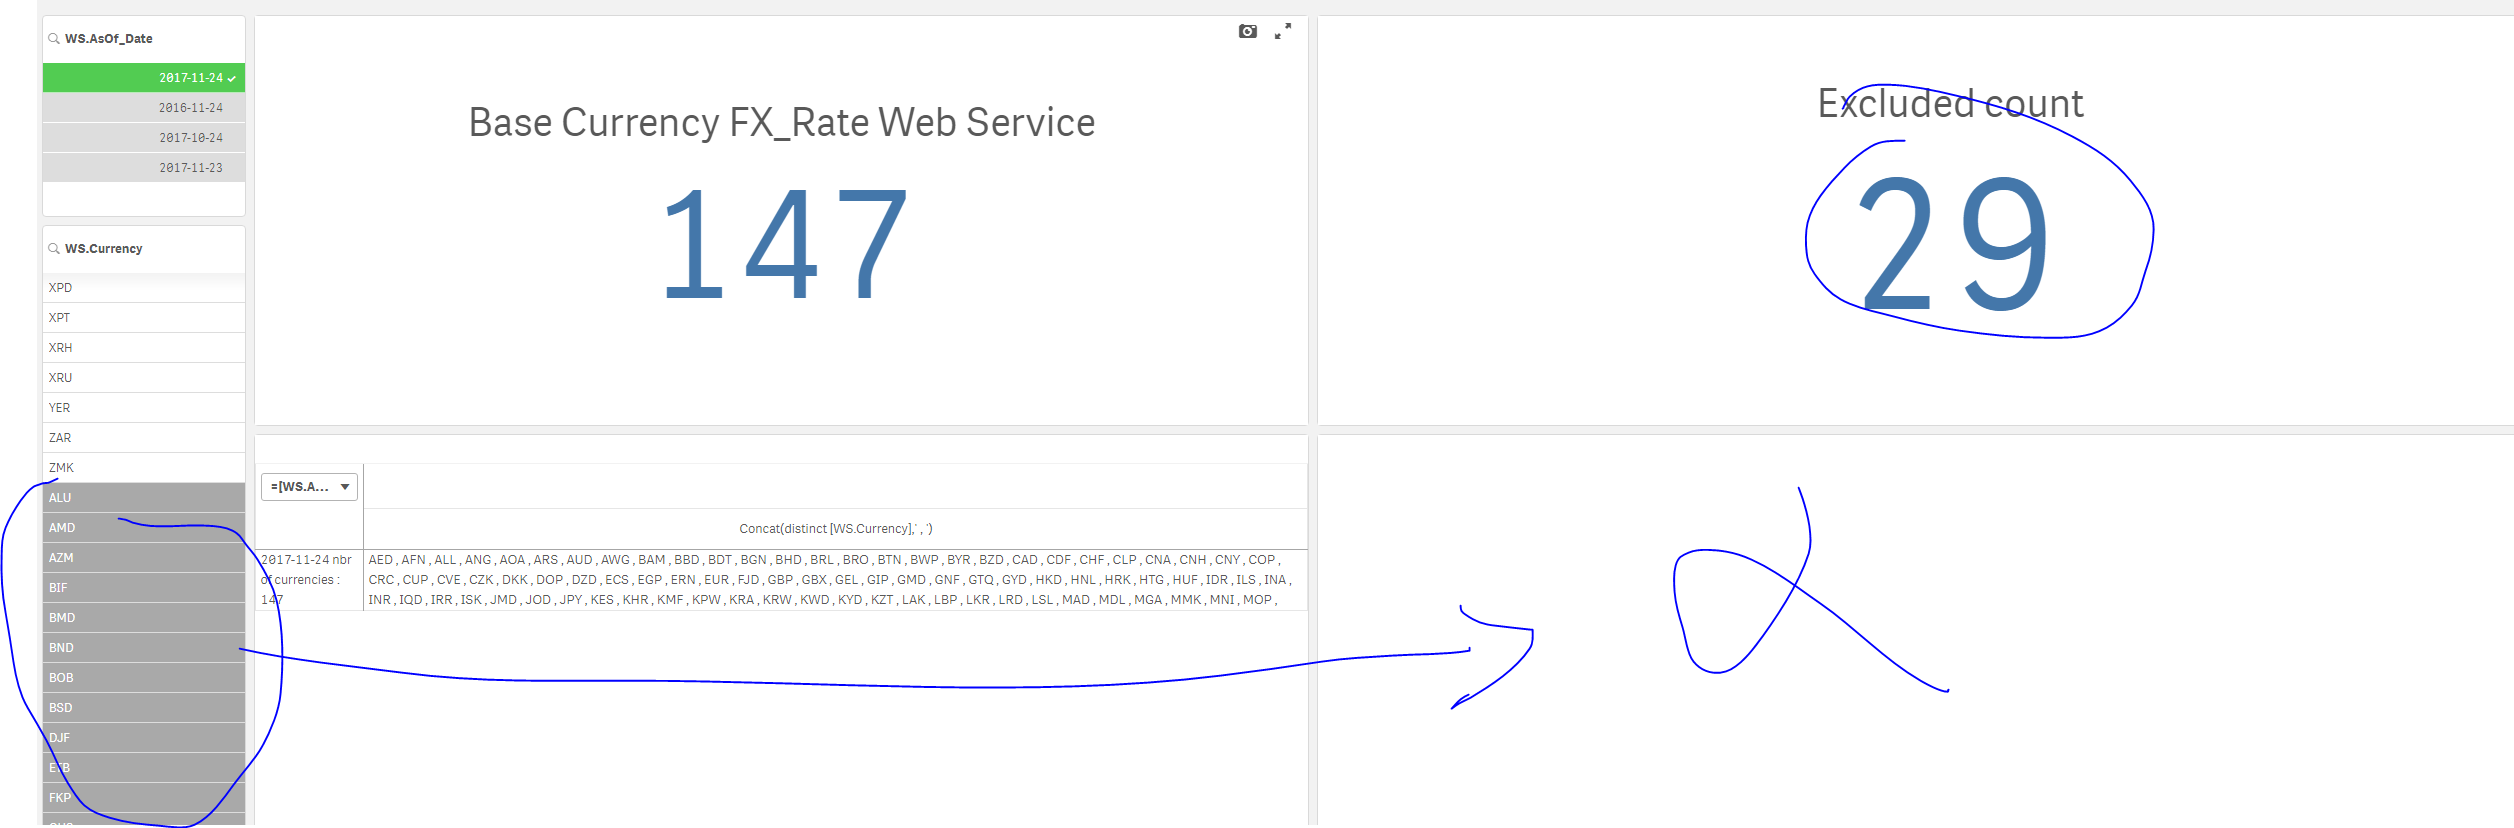
but what if I wanted to show the 20 excluded fields??
There is the GetExcludedCount function to return thenumber which is 20; but how to show these 20 values?
Thanks
- « Previous Replies
-
- 1
- 2
- Next Replies »
Accepted Solutions
- Mark as New
- Bookmark
- Subscribe
- Mute
- Subscribe to RSS Feed
- Permalink
- Report Inappropriate Content
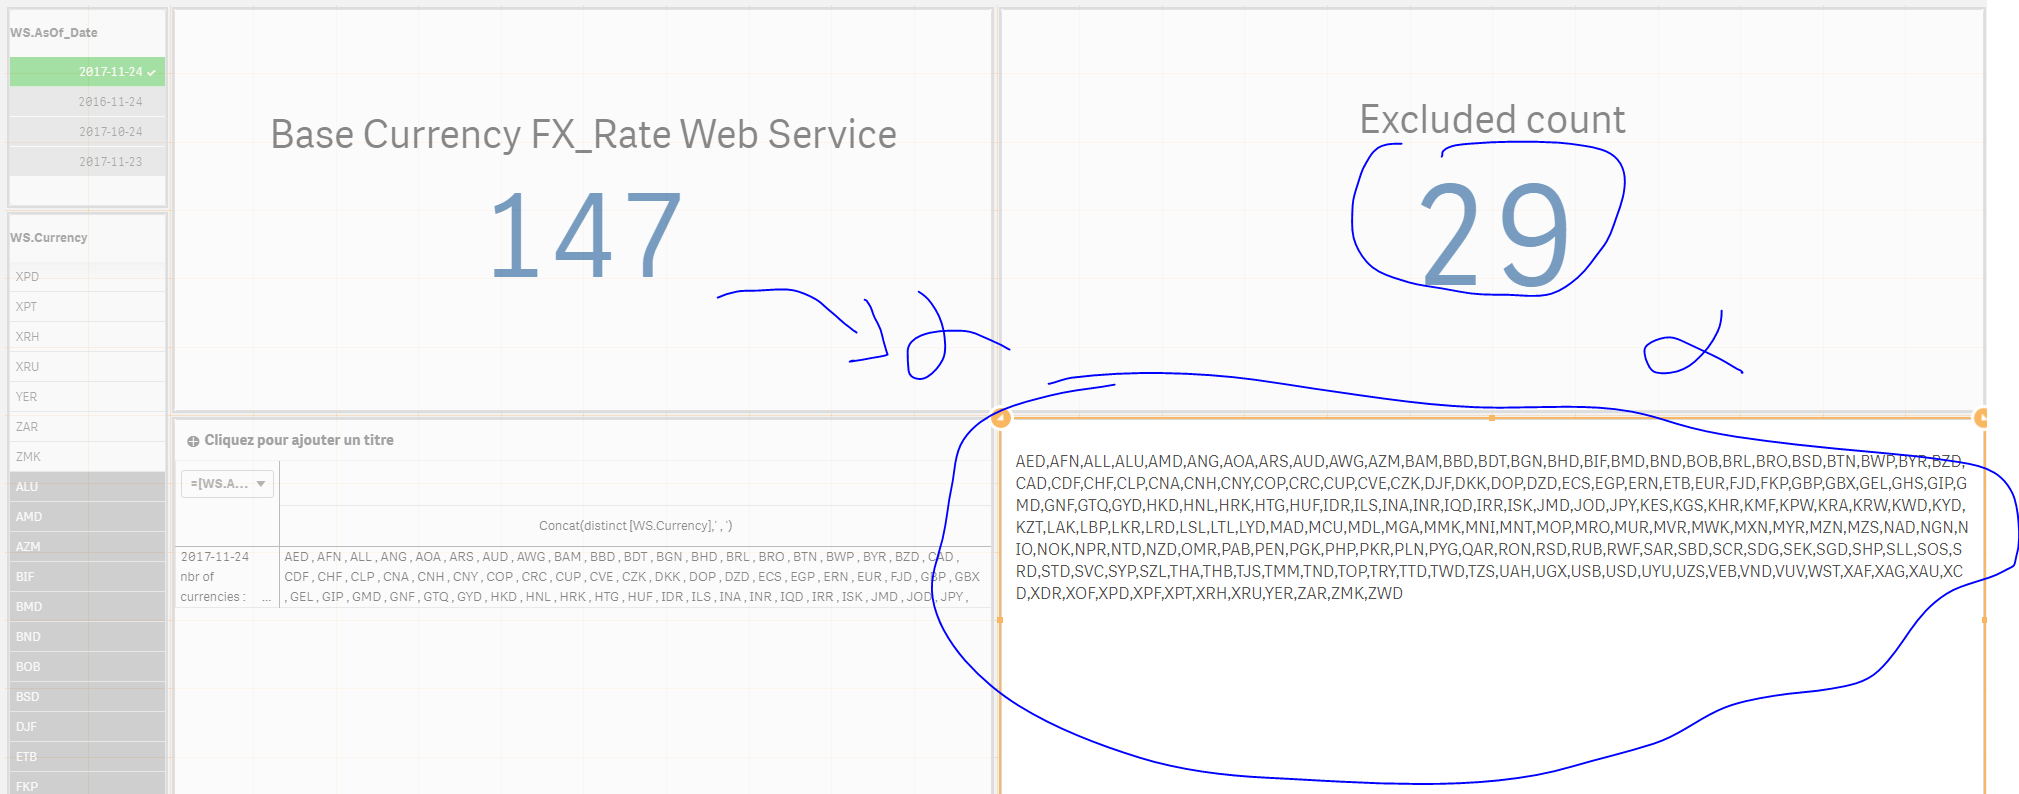
Try stigchel's way or try this
Concat(DISTINCT {1<[WS.Currency] = e([WS.Currency])>} [WS.Currency], ', ')
- Mark as New
- Bookmark
- Subscribe
- Mute
- Subscribe to RSS Feed
- Permalink
- Report Inappropriate Content
One way (not direct) is to use this
Concat({<Field = e(Field)>} Field, ', ')
- Mark as New
- Bookmark
- Subscribe
- Mute
- Subscribe to RSS Feed
- Permalink
- Report Inappropriate Content
concat({1-$}Field,',')
From the help for set Analysis
Examples:
sum( {1-$} Sales )
returns sales for everything excluded by the current selection.
- Mark as New
- Bookmark
- Subscribe
- Mute
- Subscribe to RSS Feed
- Permalink
- Report Inappropriate Content
that did not do it:
expression used:
Concat(distinct {<[WS.Currency] = e([WS.Currency])>} [WS.Currency], ', ')
- Mark as New
- Bookmark
- Subscribe
- Mute
- Subscribe to RSS Feed
- Permalink
- Report Inappropriate Content
I already tried such a thing and it returned all the 147 values (don't know why):
see:
- Mark as New
- Bookmark
- Subscribe
- Mute
- Subscribe to RSS Feed
- Permalink
- Report Inappropriate Content
Try stigchel's way or try this
Concat(DISTINCT {1<[WS.Currency] = e([WS.Currency])>} [WS.Currency], ', ')
- Mark as New
- Bookmark
- Subscribe
- Mute
- Subscribe to RSS Feed
- Permalink
- Report Inappropriate Content
Brilliant as usual
- Mark as New
- Bookmark
- Subscribe
- Mute
- Subscribe to RSS Feed
- Permalink
- Report Inappropriate Content
I have yet another question
I have this table:
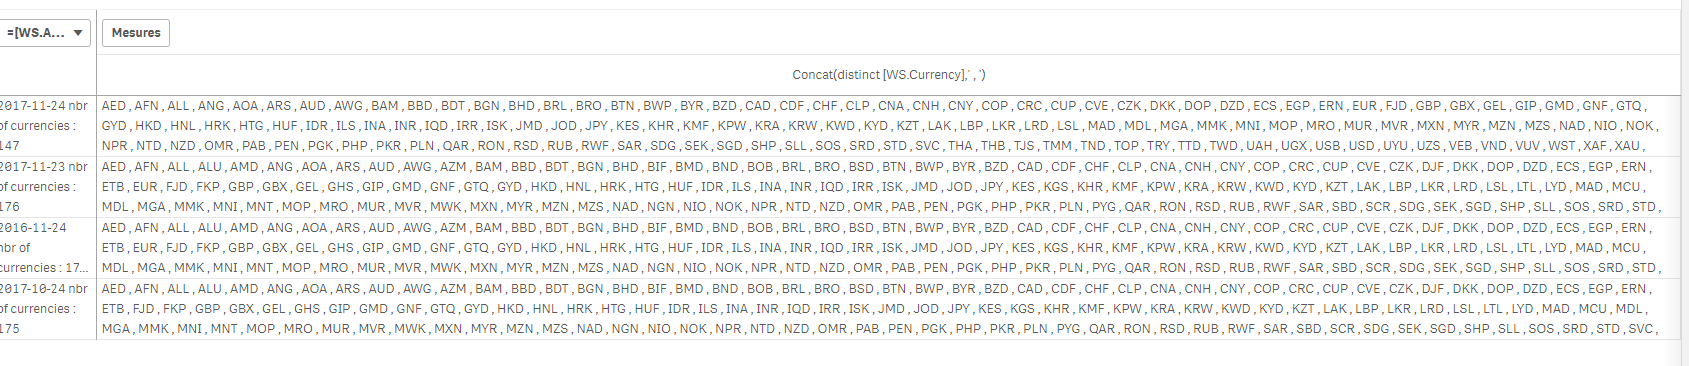
which contains currency list by date
in total there is 176 currencies; what If I wanted to show, not the list of currencies that exist in each date, but the list of those that does not (without selecting any date)
sthig like we were doing but directly within this table
- Mark as New
- Bookmark
- Subscribe
- Mute
- Subscribe to RSS Feed
- Permalink
- Report Inappropriate Content
So, you mean to show which currency don't exist on a particular day?
- Mark as New
- Bookmark
- Subscribe
- Mute
- Subscribe to RSS Feed
- Permalink
- Report Inappropriate Content
Yes ! with the previous expression; we'll have to select a date to show the currencies that do not exist
I want to show them in a table with the date as a dimension
- « Previous Replies
-
- 1
- 2
- Next Replies »