Unlock a world of possibilities! Login now and discover the exclusive benefits awaiting you.
- Qlik Community
- :
- Forums
- :
- Analytics
- :
- App Development
- :
- Display issues with barchart
- Subscribe to RSS Feed
- Mark Topic as New
- Mark Topic as Read
- Float this Topic for Current User
- Bookmark
- Subscribe
- Mute
- Printer Friendly Page
- Mark as New
- Bookmark
- Subscribe
- Mute
- Subscribe to RSS Feed
- Permalink
- Report Inappropriate Content
Display issues with barchart
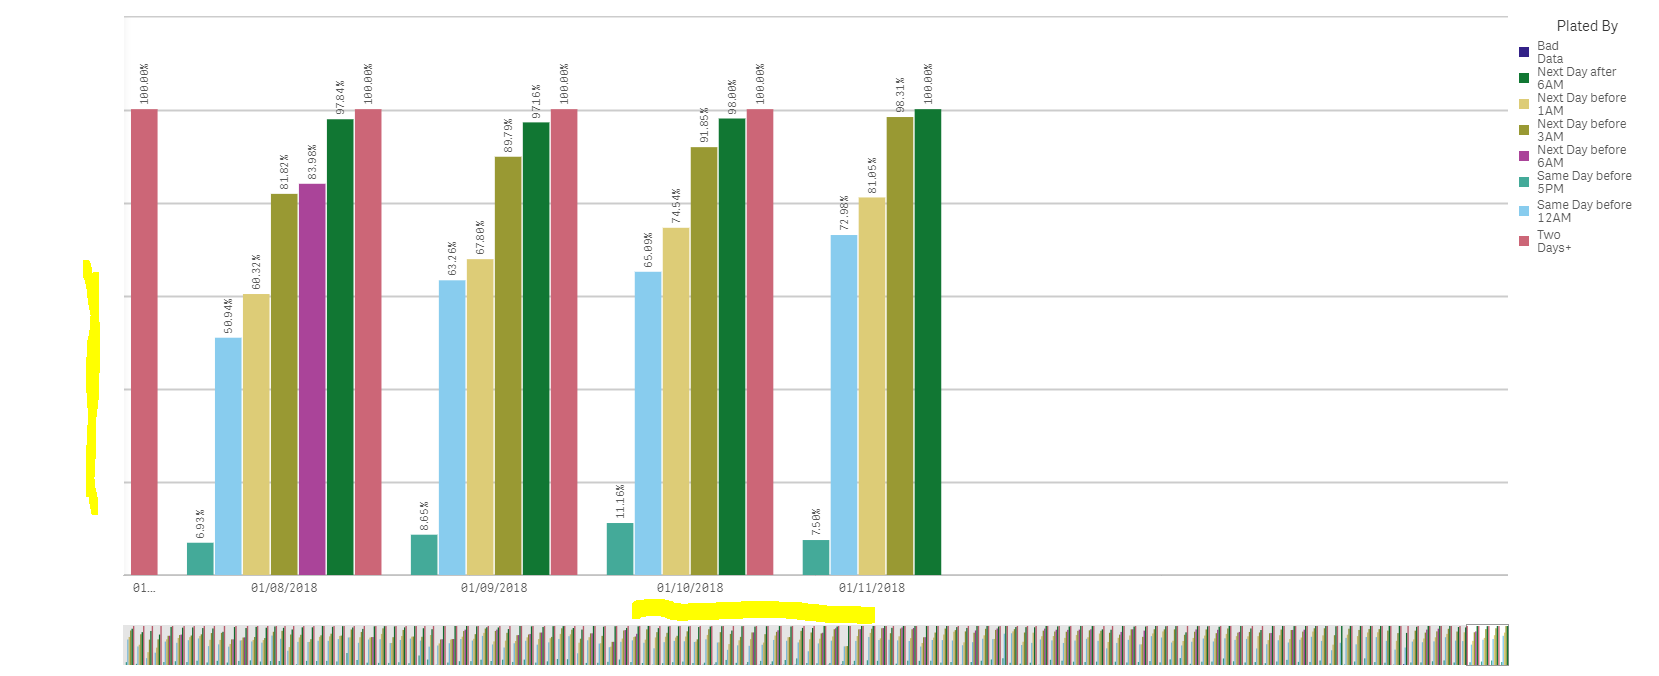
Hi I'm having some strange display issues with a bar chart. The chart uses 2 dimensions to show a cumulative percentage based on when an order is put into a specific time bucket. The first issues is that when the chart displays instead of the bars going to the end of the chart, there is a large amount of white space. At first I thought this was because of null data but I've unchecked all the "Include Null Values" settings with the same results.
See image below with highlighted area showing the white space.

Second issues is that when I move to another sheet and then back the axis labels disappear. See image below.
The only way I can get the labels back is to click in the chart as if to make a selection and then "X" out of the selection.
Thanks in advance for any help / ideas. Thanks.