Unlock a world of possibilities! Login now and discover the exclusive benefits awaiting you.
- Qlik Community
- :
- Forums
- :
- Analytics
- :
- New to Qlik Analytics
- :
- Re: Transposing data in QLiksense in chart
- Subscribe to RSS Feed
- Mark Topic as New
- Mark Topic as Read
- Float this Topic for Current User
- Bookmark
- Subscribe
- Mute
- Printer Friendly Page
- Mark as New
- Bookmark
- Subscribe
- Mute
- Subscribe to RSS Feed
- Permalink
- Report Inappropriate Content
Transposing data in QLiksense in chart
Hello All,
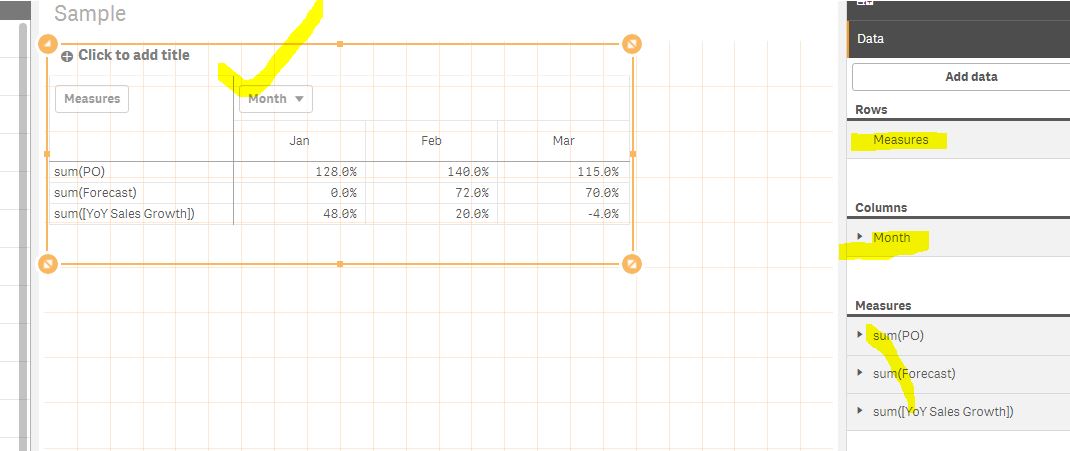
I ahve a straight table as attached in the image. I want to transpose this. I want my months to be shown as Columns and Measures as rows. I tries pivot table as well but it wont take measures as dimensions. Can a nyone help em in this?
thanks,
Nikhil Garg
- « Previous Replies
-
- 1
- 2
- Next Replies »
- Mark as New
- Bookmark
- Subscribe
- Mute
- Subscribe to RSS Feed
- Permalink
- Report Inappropriate Content
try something as below for row expression:
Aggr( sum(your_measure_field), Month )
- Mark as New
- Bookmark
- Subscribe
- Mute
- Subscribe to RSS Feed
- Permalink
- Report Inappropriate Content
Hi,
In feature, try to share the mock data in excel format,
using pivot table u can able to do the transformation (row into column.)
r u looking like this o/p ?
Thanks
Deva
- Mark as New
- Bookmark
- Subscribe
- Mute
- Subscribe to RSS Feed
- Permalink
- Report Inappropriate Content
You have to use a pivot table to achieve this; and being able to transpose your measures and dimensions.
Edit : didn't see Devarsu's reply ! Do as he said, it's the right way to achieve this
- Mark as New
- Bookmark
- Subscribe
- Mute
- Subscribe to RSS Feed
- Permalink
- Report Inappropriate Content
Yes,
I am looking same kind of format
- Mark as New
- Bookmark
- Subscribe
- Mute
- Subscribe to RSS Feed
- Permalink
- Report Inappropriate Content
Hi,
you can refer to steps from attached app (remember to drag measure from column to row and month to column )
and let us know if any issue. once all ok then help to close this thread. tks
- Mark as New
- Bookmark
- Subscribe
- Mute
- Subscribe to RSS Feed
- Permalink
- Report Inappropriate Content
Hey,
Thanks . Now i want to show YTD value as well as last column i.e. after month Dec, i want a column YTD showing YTD for all 3 measures. Can you help em in this?.
- Mark as New
- Bookmark
- Subscribe
- Mute
- Subscribe to RSS Feed
- Permalink
- Report Inappropriate Content
Hi,
When we do the transformation we can add only total of dimension value ( u r case Month ) at the end column. if u wish to shown YTD measure as column then it's possible in previous transformation state. i would suggest you to provide mock data and expected output then we can try if there workaround method.
Thanks,
Deva
- Mark as New
- Bookmark
- Subscribe
- Mute
- Subscribe to RSS Feed
- Permalink
- Report Inappropriate Content
Hey Deva,
Pls. find the attached excel file showing the output that i want. Can you help me in this?
Thanks,
Nikhil Garg
- Mark as New
- Bookmark
- Subscribe
- Mute
- Subscribe to RSS Feed
- Permalink
- Report Inappropriate Content
Hi
Just tried to enable the Total on your Month Dimension (like attached screen )
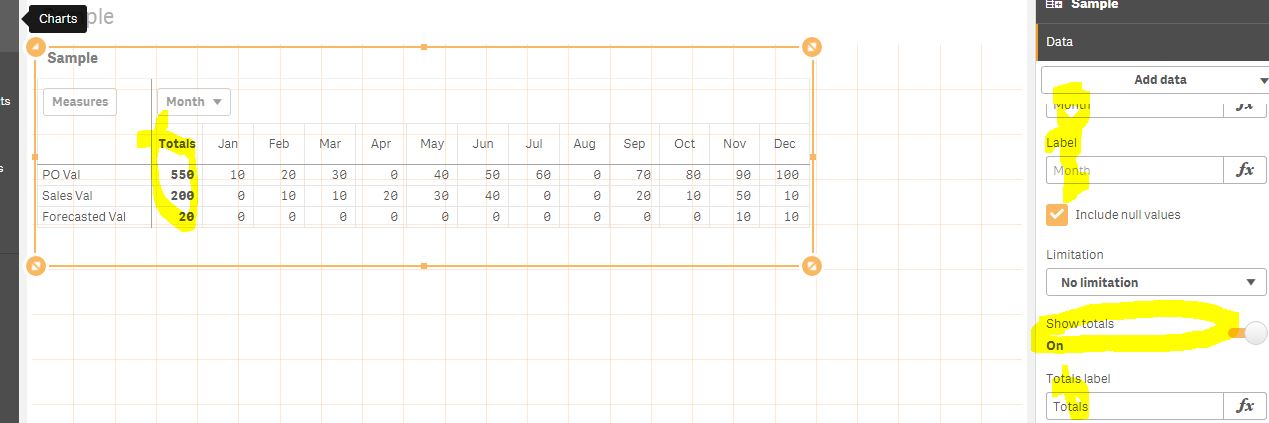
P.S: Default qliksense pivot chart have show total as before and don't have after option. the total label u can changed to YTD total
Thanks,Deva
- « Previous Replies
-
- 1
- 2
- Next Replies »