Unlock a world of possibilities! Login now and discover the exclusive benefits awaiting you.
- Qlik Community
- :
- Forums
- :
- Analytics
- :
- New to Qlik Analytics
- :
- Re: Extract fields from GetFieldSelections
- Subscribe to RSS Feed
- Mark Topic as New
- Mark Topic as Read
- Float this Topic for Current User
- Bookmark
- Subscribe
- Mute
- Printer Friendly Page
- Mark as New
- Bookmark
- Subscribe
- Mute
- Subscribe to RSS Feed
- Permalink
- Report Inappropriate Content
Extract fields from GetFieldSelections
I have [Month] as a filter. I want to be able to select certain months at a random order and run a part of a code for those Months alone.
if(GetSelectedCount([Change])=1 and GetSelectedCount(Month)=1 ,
if(avg(TransitionMonthNum)>=num(Month),
Rangesum(above(total(sum({<Version={'1YP'}>}Value)),0,rowno(total)))
+ sum(total {<TransitionMonth={'$(=getfieldselections(Month))'} , Version={'1YP'}>}Value)*[Change]/100,
Rangesum(above(total(sum({<Version={'1YP'}>}Value)),0,rowno(total)))
)
)
The above code works when only one [Month] is selected. I want this to run when GetSelectedCount(Month)>1 and have the values from GetFieldSelections(Month) in an array or something, and then create a loop, so that the code works for all the months selected.
What would be the best way to do this?
- « Previous Replies
-
- 1
- 2
- Next Replies »
- Mark as New
- Bookmark
- Subscribe
- Mute
- Subscribe to RSS Feed
- Permalink
- Report Inappropriate Content
The Output I have now is something like this:
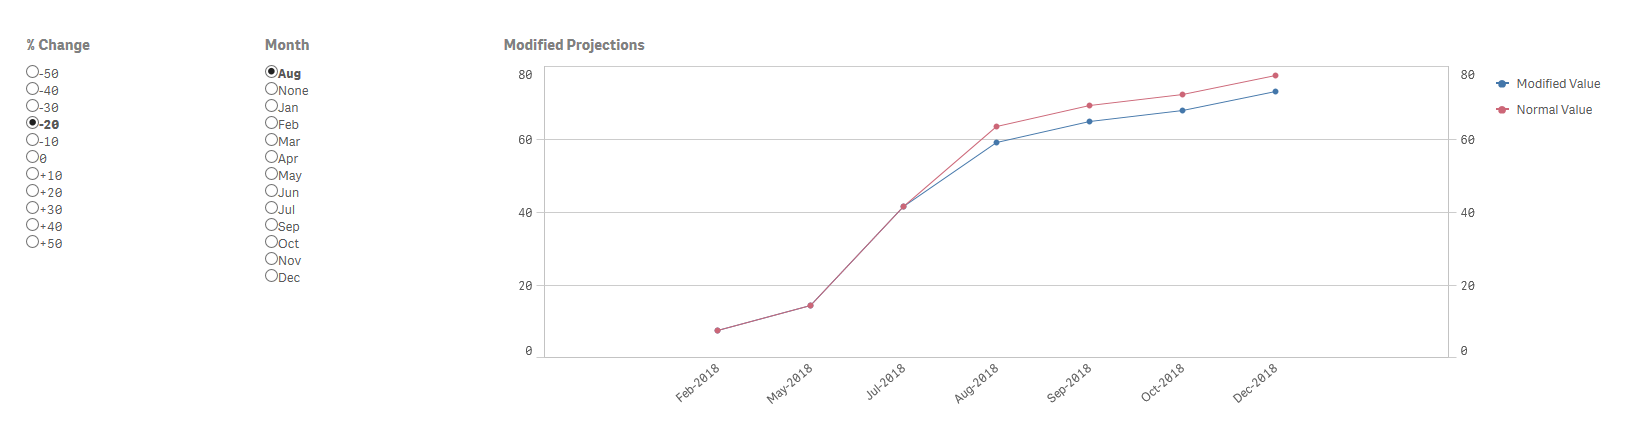
I want to be able to do this for multiple Months.
stalwar1 It's very sensitive data and I have to de-sensitize it before I can send it to you. Let me know if the image helps at all.
Thanks.
- Mark as New
- Bookmark
- Subscribe
- Mute
- Subscribe to RSS Feed
- Permalink
- Report Inappropriate Content
When you say that you want to do this for multiple months, what exactly do you mean? See more than 7 months you see now?
- Mark as New
- Bookmark
- Subscribe
- Mute
- Subscribe to RSS Feed
- Permalink
- Report Inappropriate Content
No, I will still see 7 months. In the graph above, the line starts diverging in Aug because that's the filter I have selected. The [Value] for Aug decreases by 20%. If I want to know what happens if we change [Value] by 20% for both Aug and Sep, the graph should be able to show that.
- Mark as New
- Bookmark
- Subscribe
- Mute
- Subscribe to RSS Feed
- Permalink
- Report Inappropriate Content
So, this is starting to make a lot more sense. What happens when you select 2 months without any changes? Errors out? incorrect result?
- Mark as New
- Bookmark
- Subscribe
- Mute
- Subscribe to RSS Feed
- Permalink
- Report Inappropriate Content
It displays nothing.
- « Previous Replies
-
- 1
- 2
- Next Replies »