Unlock a world of possibilities! Login now and discover the exclusive benefits awaiting you.
- Qlik Community
- :
- Forums
- :
- Analytics
- :
- App Development
- :
- Re: How to make dynamic percentage calculation for...
- Subscribe to RSS Feed
- Mark Topic as New
- Mark Topic as Read
- Float this Topic for Current User
- Bookmark
- Subscribe
- Mute
- Printer Friendly Page
- Mark as New
- Bookmark
- Subscribe
- Mute
- Subscribe to RSS Feed
- Permalink
- Report Inappropriate Content
How to make dynamic percentage calculation for each group on pivot
Hi all,
I want to show percentage %ofParentTotal for each group on pivot table. I can make it by checking dimensionality of cell and calculate the %ofParentTotal for each group.
sum(VALUE)/
Pick(Dimensionality()+1,
sum(total VALUE),
sum(total VALUE),
sum(total <DIM1> VALUE),
sum(total <DIM1,DIM2> VALUE),
)
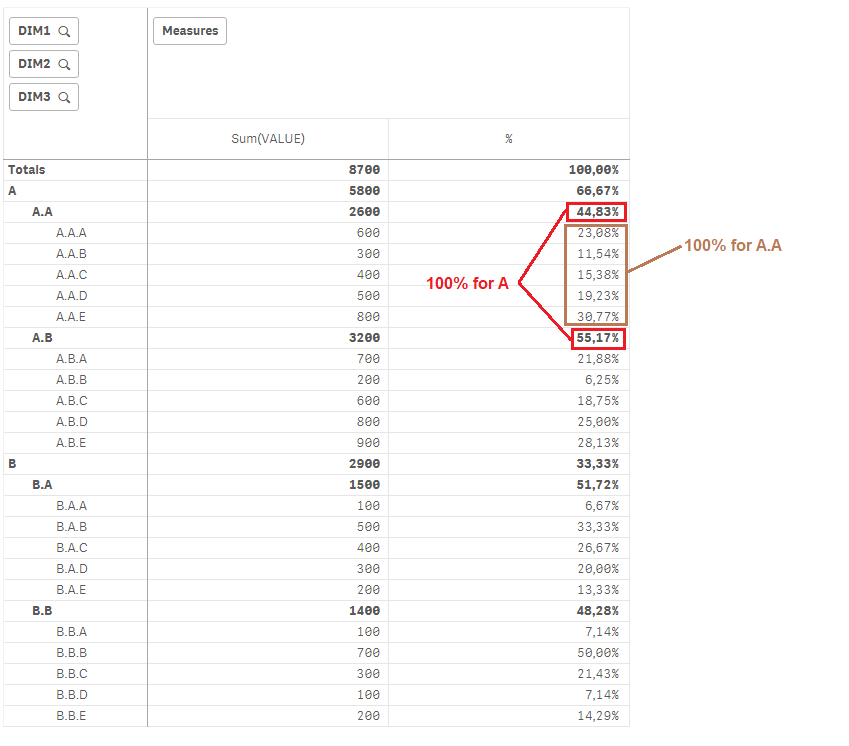
but I need to calculate it without checking dimensionality. Actually, I don't want to edit the expression when any dimension is added. It is not effective 
Is there any way to achieve this?
Thanks,
- Mark as New
- Bookmark
- Subscribe
- Mute
- Subscribe to RSS Feed
- Permalink
- Report Inappropriate Content
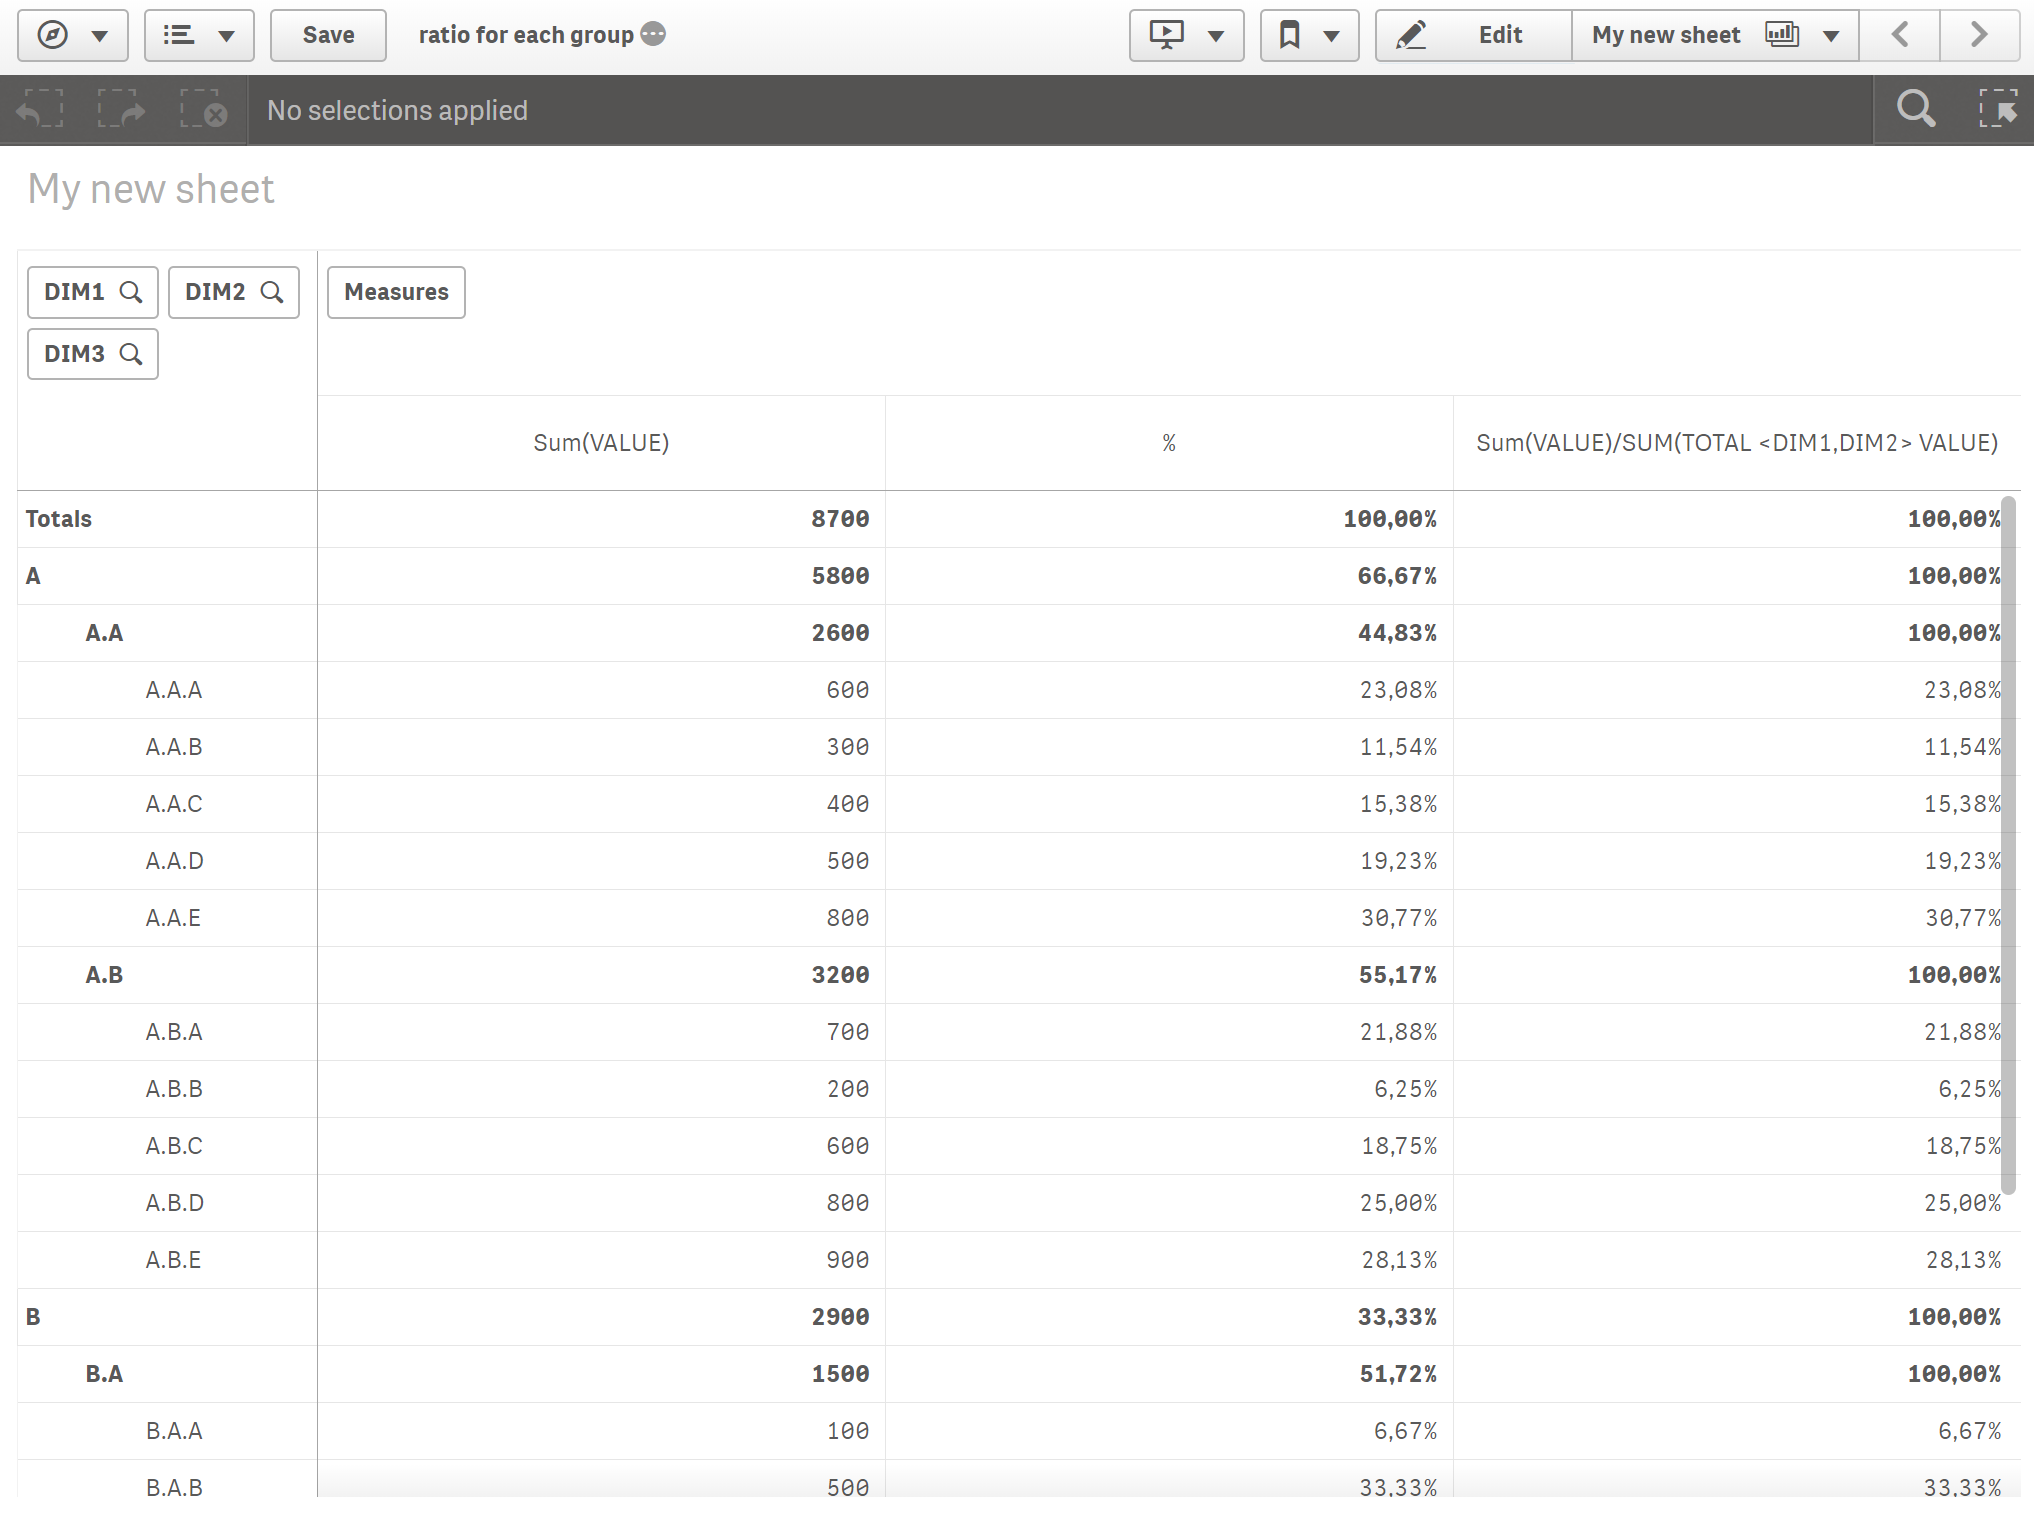
I guess this is closer to what you are looking for?
- Mark as New
- Bookmark
- Subscribe
- Mute
- Subscribe to RSS Feed
- Permalink
- Report Inappropriate Content
Furthermore you can make it dynamic as to which two first dimensions you put in the pivot by using the GetObjectField() function. It is a rather strange name for the function since it retrieves the name of the dimension you select:
Sum(VALUE)/SUM(TOTAL <$(=GetObjectField(0)),$(=GetObjectField(1))> VALUE)
This expression will adjust to whichever dimensions you put in the pivot.
- Mark as New
- Bookmark
- Subscribe
- Mute
- Subscribe to RSS Feed
- Permalink
- Report Inappropriate Content
Hi Petter,
Thanks for this idea! I have a bar chart that shows month on month 100% stacked bar chart and my formula is like:
count({<Status={'Approved'}>}distinct appl_no)
/
count({<Status={'Approved'}>}total <MonthYear> distinct appl_no)
NOW, I want to make my dimension into drill down MonthYear > Date but my formula fails ofcourse when drilling down into dates and unfortunately when I try GetObjectField it results into an error. Can you please advise? thank you!