Unlock a world of possibilities! Login now and discover the exclusive benefits awaiting you.
- Qlik Community
- :
- Forums
- :
- Analytics
- :
- New to Qlik Analytics
- :
- Re: How to display the latest two month in this ca...
Options
- Subscribe to RSS Feed
- Mark Topic as New
- Mark Topic as Read
- Float this Topic for Current User
- Bookmark
- Subscribe
- Mute
- Printer Friendly Page
Turn on suggestions
Auto-suggest helps you quickly narrow down your search results by suggesting possible matches as you type.
Showing results for
Anonymous
Not applicable
2018-04-05
10:22 PM
- Mark as New
- Bookmark
- Subscribe
- Mute
- Subscribe to RSS Feed
- Permalink
- Report Inappropriate Content
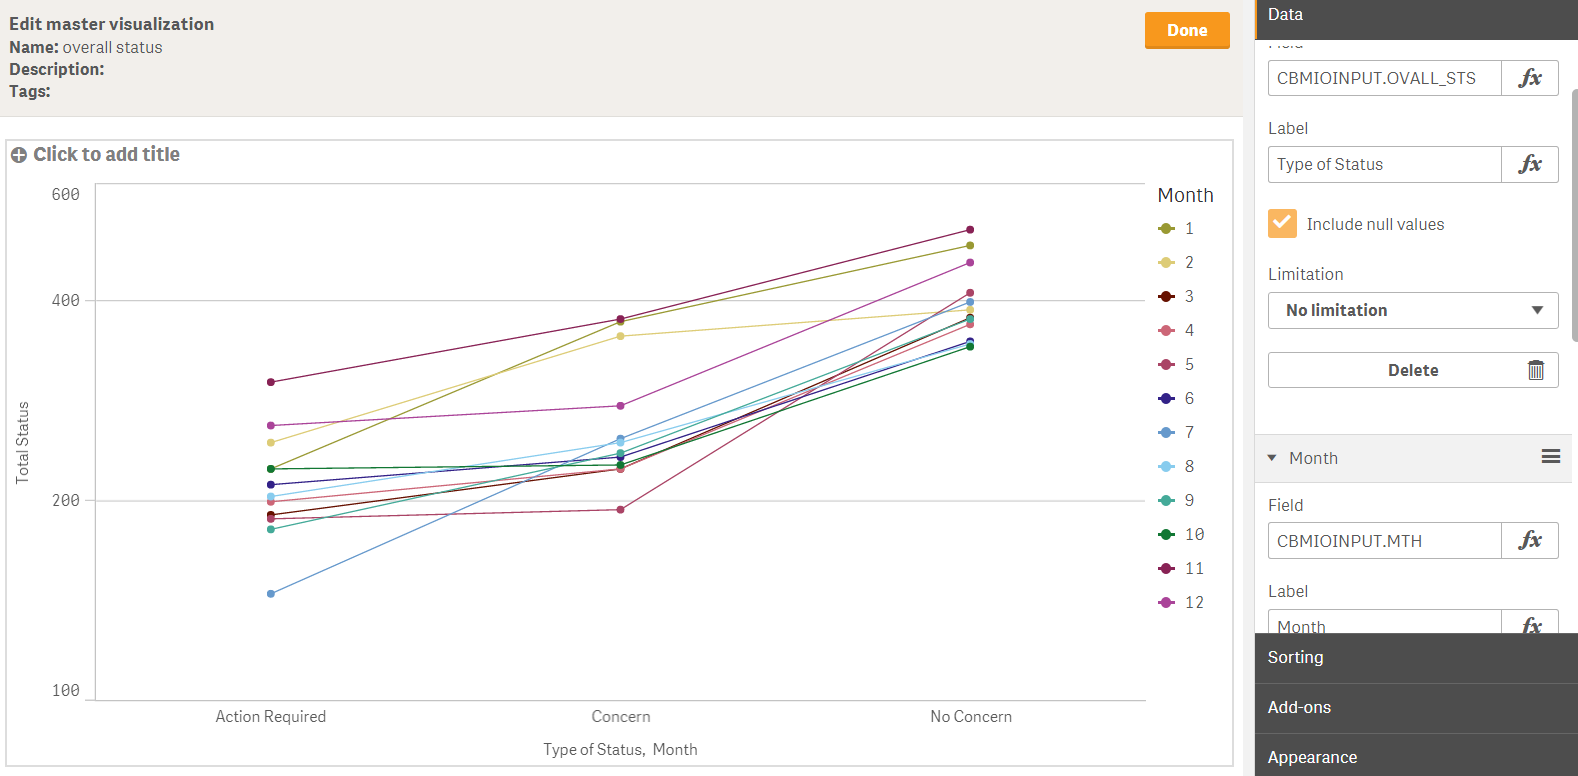
How to display the latest two month in this case?
I am trying to show the last 2 months of data on a line chart as picture below but I do not know on how to do it. Appreciate if someone could help me to slove this problem.
Thanks,
Shahana
222 Views
3 Replies
MVP
2018-04-12
11:44 AM
- Mark as New
- Bookmark
- Subscribe
- Mute
- Subscribe to RSS Feed
- Permalink
- Report Inappropriate Content
So you want to see month 11 and 12? May be set analysis or calculated dimension
188 Views
Anonymous
Not applicable
2018-04-15
10:13 PM
Author
- Mark as New
- Bookmark
- Subscribe
- Mute
- Subscribe to RSS Feed
- Permalink
- Report Inappropriate Content
Thank for your reply Sunny.
Yes. i just wanna show month 11 and 12 only. I had tried set the dimension as below and it still not functioning.
Sum({$<Month={1,2}>} [Action Required])
188 Views
MVP
2018-07-23
11:29 AM
- Mark as New
- Bookmark
- Subscribe
- Mute
- Subscribe to RSS Feed
- Permalink
- Report Inappropriate Content
If you want 11 and 12... why are you using 1 and 2 in set analysis? Also, you mentioned dimension... are you using this as dimension or expression?
188 Views
Community Browser