Unlock a world of possibilities! Login now and discover the exclusive benefits awaiting you.
- Qlik Community
- :
- Forums
- :
- Analytics
- :
- New to Qlik Analytics
- :
- Re: Set analysis chart measure ignoring axis dimen...
- Subscribe to RSS Feed
- Mark Topic as New
- Mark Topic as Read
- Float this Topic for Current User
- Bookmark
- Subscribe
- Mute
- Printer Friendly Page
- Mark as New
- Bookmark
- Subscribe
- Mute
- Subscribe to RSS Feed
- Permalink
- Report Inappropriate Content
Set analysis chart measure ignoring axis dimension
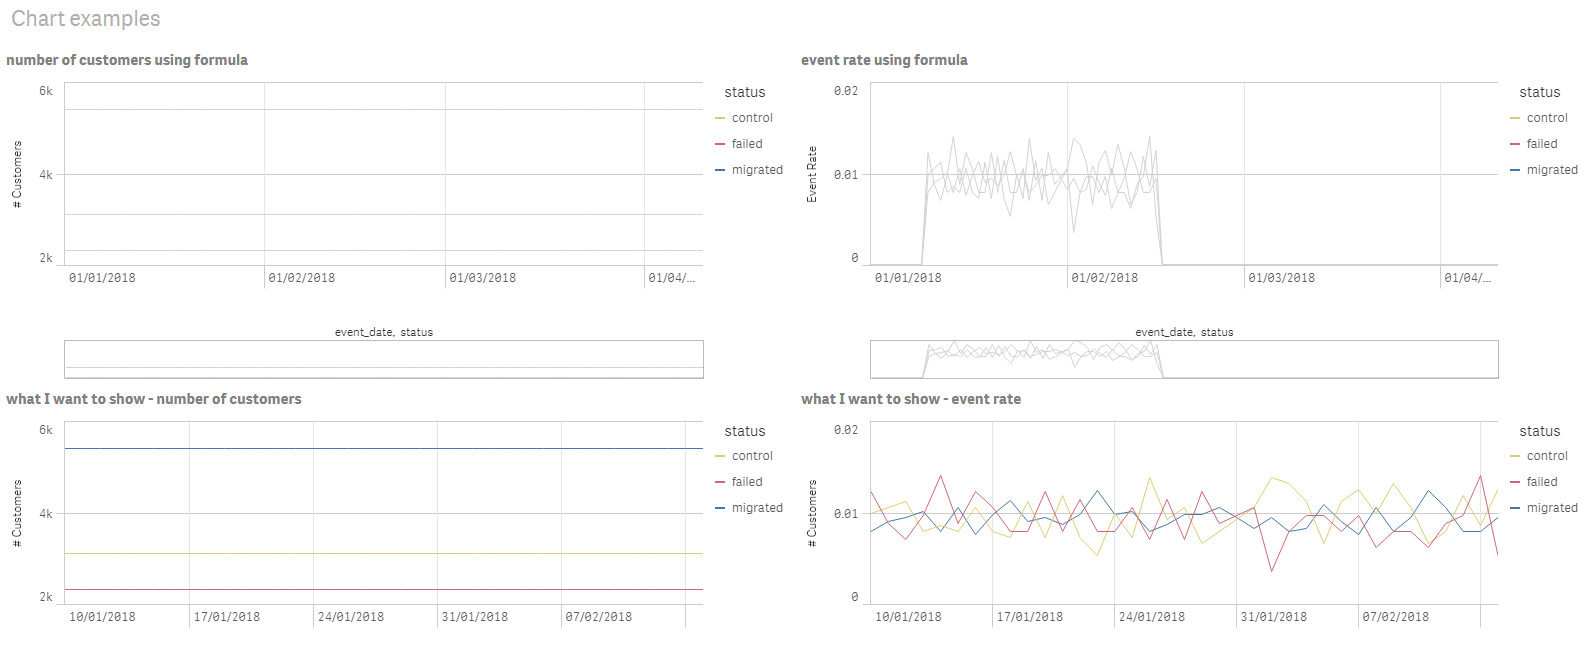
What I am trying to achieve is have a chart which shows the total number of events per day divided by the total number of people in a group.
Some of the people in the group do not ever have an event, so when I add the event_date as an axis these are excluded from the base count.
If you look at the second tab of the attached QVF file you can see what I'm trying to achieve, I would normally have thought that the following expression:
COUNT(TOTAL <status> DISTINCT {<event_date=>} customer_id)
But this only gives me the number of customers who have ever had an event, and does not include the count of people who have not had one event ever.
- Mark as New
- Bookmark
- Subscribe
- Mute
- Subscribe to RSS Feed
- Permalink
- Report Inappropriate Content
How about if you try this?
Only({<event_date=>}Aggr(NODISTINCT COUNT(DISTINCT {<event_date=>} customer_id), status))
- Mark as New
- Bookmark
- Subscribe
- Mute
- Subscribe to RSS Feed
- Permalink
- Report Inappropriate Content
This works if I don't select any value on the axis of the chart - if I pick any dates on the x axis of the charts the values go to blank / null. I'm hoping to be able to show the # of total customers even if you select a date range for event_date.
Thanks
- Mark as New
- Bookmark
- Subscribe
- Mute
- Subscribe to RSS Feed
- Permalink
- Report Inappropriate Content
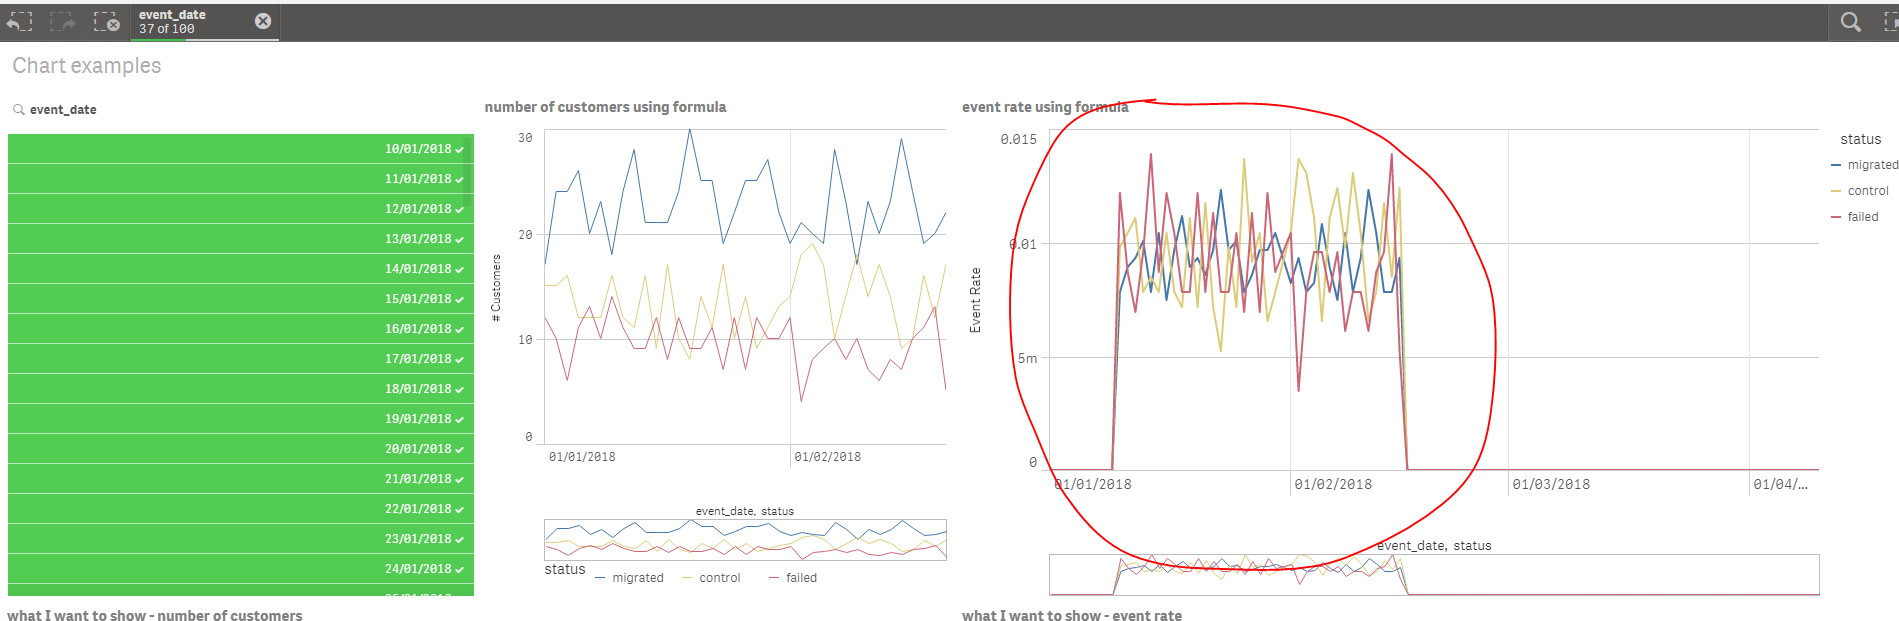
I selected event_date and still seeing the chart
Are you seeing something different?
- Mark as New
- Bookmark
- Subscribe
- Mute
- Subscribe to RSS Feed
- Permalink
- Report Inappropriate Content
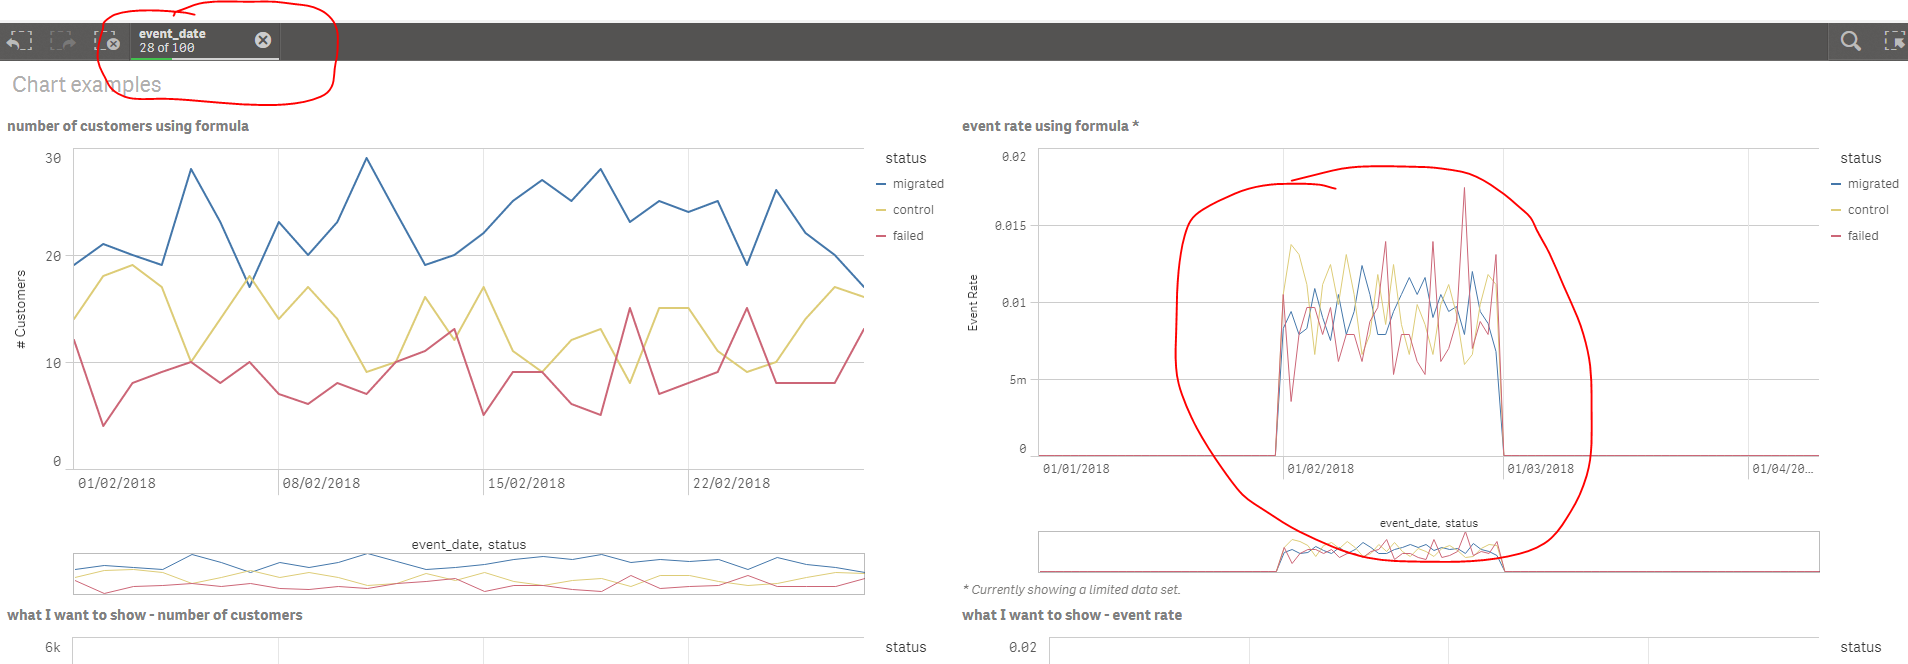
This happens if I pick 10th Jan to 15th of feb as an example
- Mark as New
- Bookmark
- Subscribe
- Mute
- Subscribe to RSS Feed
- Permalink
- Report Inappropriate Content
Not sure if you are looking at the file I attached, but I am seeing this
- Mark as New
- Bookmark
- Subscribe
- Mute
- Subscribe to RSS Feed
- Permalink
- Report Inappropriate Content
Even with this, I would like the axis to only show the selected dates, which isn't the case in the attached screenshot you provided - is this even possible?
- Mark as New
- Bookmark
- Subscribe
- Mute
- Subscribe to RSS Feed
- Permalink
- Report Inappropriate Content
I guess the bigger problem is/was that if you are not seeing what i am seeing... if you are now able to see it, we can work on removing the extra stuff out of the way...
- Mark as New
- Bookmark
- Subscribe
- Mute
- Subscribe to RSS Feed
- Permalink
- Report Inappropriate Content
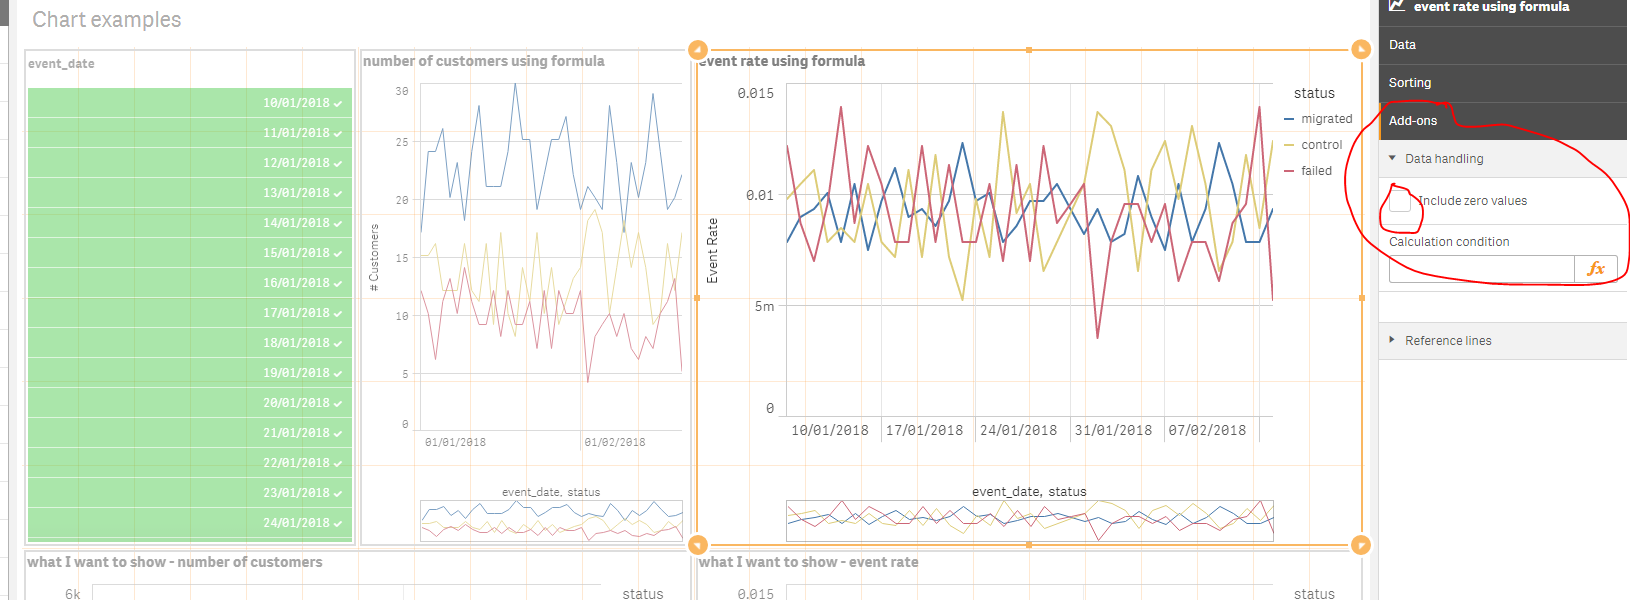
To remove the extra stuff... uncheck 'Include zero values' under Add-ons -> Data handling