Unlock a world of possibilities! Login now and discover the exclusive benefits awaiting you.
- Qlik Community
- :
- Forums
- :
- Analytics
- :
- App Development
- :
- Re: 100% Bar chart with 2 dimensions and one measu...
- Subscribe to RSS Feed
- Mark Topic as New
- Mark Topic as Read
- Float this Topic for Current User
- Bookmark
- Subscribe
- Mute
- Printer Friendly Page
- Mark as New
- Bookmark
- Subscribe
- Mute
- Subscribe to RSS Feed
- Permalink
- Report Inappropriate Content
100% Bar chart with 2 dimensions and one measure
Hi All,
Is it possible to create a 100% stacked bar with 2 dimensions and 1 measure
I have a bar chart with some sales value for 2 years.
Required: Create alternate measure to fit in fig 1 to show 100% split between products (as shown in Fig 3)
What I am getting is Fig 2 split between years as alternate measure.
I can create 4 measures to get total to 100% but its not ideal as I will be duplicating 10 graphs for # and %.
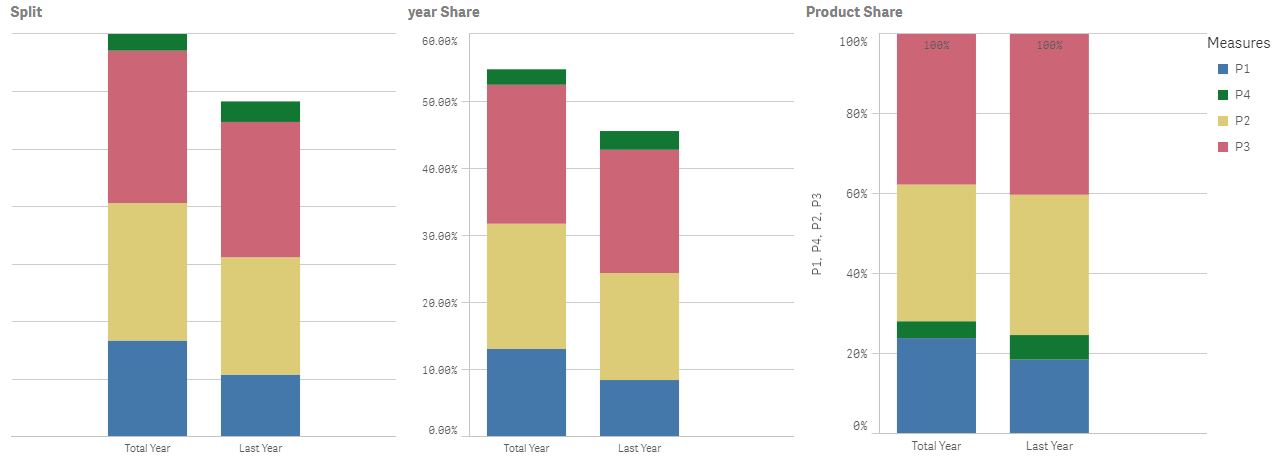
Fig 1 measure: Sum(Sales)
Fig 2: Sum(Sales) /sum(total <Year> Sales)
Fig 3:
Currently creating 4 measure for each product:
num(sum({$<Product={'P1'} >} Sales)
/sum({<Product= {'P1','P2','P3','P4'}>}Sales),'#,##0%')
Is there any way I can create a one measure to get these split for products to be 100% with 2 dimensions.
- Mark as New
- Bookmark
- Subscribe
- Mute
- Subscribe to RSS Feed
- Permalink
- Report Inappropriate Content
What is your first dimension? Is it Year or something else?
- Mark as New
- Bookmark
- Subscribe
- Mute
- Subscribe to RSS Feed
- Permalink
- Report Inappropriate Content
First Dimension: Year
Second Dimension: Product
- Mark as New
- Bookmark
- Subscribe
- Mute
- Subscribe to RSS Feed
- Permalink
- Report Inappropriate Content
Is year a calculated or derived field by any chance?
- Mark as New
- Bookmark
- Subscribe
- Mute
- Subscribe to RSS Feed
- Permalink
- Report Inappropriate Content
I have edited the Auto calendar to derive a YearAgo field for Total year & last Year
if(12*Year(Today())+Month(Today())-12*Year($1)-Month($1) >=1 and 12*Year(Today())+Month(Today())-12*Year($1)-Month($1) <= 12, 'Total Year',
if(12*Year(Today())+Month(Today())-12*Year($1)-Month($1) >=13 and 12*Year(Today())+Month(Today())-12*Year($1)-Month($1) <= 24,'Last Year',null())) as YearAgo,