Unlock a world of possibilities! Login now and discover the exclusive benefits awaiting you.
- Qlik Community
- :
- Forums
- :
- Analytics
- :
- New to Qlik Analytics
- :
- Qlik sense Stacked Bar with a line
Options
- Subscribe to RSS Feed
- Mark Topic as New
- Mark Topic as Read
- Float this Topic for Current User
- Bookmark
- Subscribe
- Mute
- Printer Friendly Page
Turn on suggestions
Auto-suggest helps you quickly narrow down your search results by suggesting possible matches as you type.
Showing results for
Anonymous
Not applicable
2018-05-08
03:25 AM
- Mark as New
- Bookmark
- Subscribe
- Mute
- Subscribe to RSS Feed
- Permalink
- Report Inappropriate Content
Qlik sense Stacked Bar with a line
Hi All,
I have good experience in Qlikview, however I am new to qlik sense. I am facing challenge to customize a graph with Stacked Bars with a line. I am using D3 Visualization Library to create this chart which came out to be expected. But there is no option to change the colors in this extension. Would be great help if anyone suggest other extensions to achieve the same or any way to change in the same extension. I am attaching the extension for the reference. and the graph image is 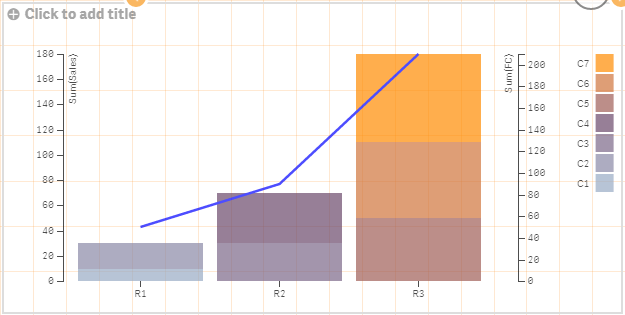 as below:
446 Views
0 Replies
Community Browser