Unlock a world of possibilities! Login now and discover the exclusive benefits awaiting you.
- Qlik Community
- :
- Forums
- :
- Analytics
- :
- New to Qlik Analytics
- :
- Re: Accumulate over 2 dimensions - Pivot works, ch...
- Subscribe to RSS Feed
- Mark Topic as New
- Mark Topic as Read
- Float this Topic for Current User
- Bookmark
- Subscribe
- Mute
- Printer Friendly Page
- Mark as New
- Bookmark
- Subscribe
- Mute
- Subscribe to RSS Feed
- Permalink
- Report Inappropriate Content
Accumulate over 2 dimensions - Pivot works, chart incorrect
Hi all,
I'm trying to show the % of customers who buy a product when they buy their next product. In my data I have First Product, Months until next product (SPD) and the number/% of customers.
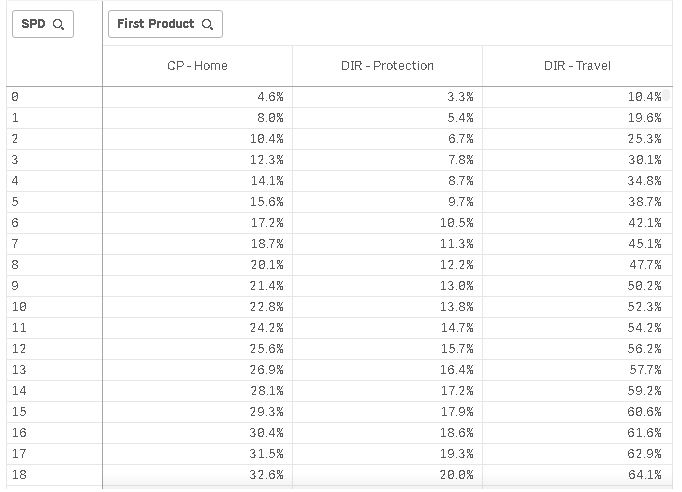
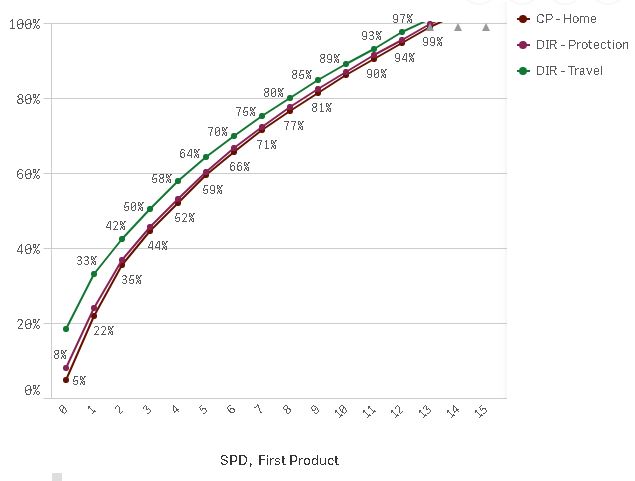
I've read a lot of posts on using rangesum(above( and also Pareto techniques. The pivot table below, works and shows the correct % for each product, but when I change to a chart it seems to accumulate the '%' for each product within the SPD so the lines all appear much closer than it should be. any help much appreciated!
Calculation that works in Pivot table:
RangeSum(Above(total( Sum([# of Individuals])/ sum(total <[First Product]>[# of Individuals])), 0, RowNo( TOTAL)))
Correct Pivot
Incorrect Chart
Thanks
Mike.
- Tags:
- qlik sense
- « Previous Replies
-
- 1
- 2
- Next Replies »
- Mark as New
- Bookmark
- Subscribe
- Mute
- Subscribe to RSS Feed
- Permalink
- Report Inappropriate Content
Have done, apologies. 🙂
- « Previous Replies
-
- 1
- 2
- Next Replies »