Unlock a world of possibilities! Login now and discover the exclusive benefits awaiting you.
- Qlik Community
- :
- All Forums
- :
- QlikView App Dev
- :
- Calculating percentage of occurrences
- Subscribe to RSS Feed
- Mark Topic as New
- Mark Topic as Read
- Float this Topic for Current User
- Bookmark
- Subscribe
- Mute
- Printer Friendly Page
- Mark as New
- Bookmark
- Subscribe
- Mute
- Subscribe to RSS Feed
- Permalink
- Report Inappropriate Content
Calculating percentage of occurrences
Hi Everyone,
I thought it might be simple, but I am having bit trouble to show in the following manner. I have a table like as below:
LOAD * INLINE [
Name, How often
A, DAILY
B, DAILY
C, DAILY
D, WEEKLY
E, WEEKLY
F, MONTHLY
G, MONTHLY
H, MONTHLY
I, YEARLY
J, YEARLY
K, WEEKLY
L, WEEKLY
M, WEEKLY
N, MONTHLY
O, DAILY
P, DAILY
Q, DAILY
R, DAILY
S, DAILY
T, WEEKLY
]
And I want to show something like below may be using straight table or a pivot table.
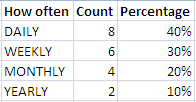
I managed to show the first two columns, by taking [How often] as a dimension, and Count ( [How often]) as an expression in a straight table, but struggling to write an another expression for percentage. Individual percentage is [individual count / total records * 100], for e.g. 8 / 20 * 100 = 40%
If anyone can help me, it would be appreciated. Regards.
Accepted Solutions
- Mark as New
- Bookmark
- Subscribe
- Mute
- Subscribe to RSS Feed
- Permalink
- Report Inappropriate Content
Hi,
Just create a new expression refering the first one (for example with column(1)) and check the relative button.
Regards,
Vincent
- Mark as New
- Bookmark
- Subscribe
- Mute
- Subscribe to RSS Feed
- Permalink
- Report Inappropriate Content
Hi,
Just create a new expression refering the first one (for example with column(1)) and check the relative button.
Regards,
Vincent
- Mark as New
- Bookmark
- Subscribe
- Mute
- Subscribe to RSS Feed
- Permalink
- Report Inappropriate Content
WOW, Awesome.
Thanks and Regards
- Mark as New
- Bookmark
- Subscribe
- Mute
- Subscribe to RSS Feed
- Permalink
- Report Inappropriate Content
Hi There,
You could use the "TOTAL" keyword to calculate the Total Records. Create a straight table and use the "How Often: field as a dimension and add the following expression:
= (count([How often]) / ( count(TOTAL([Name]))))
Then Set the format to "Fixed To" and check the "Show in Percent%" field on the Number tab.
Hope this helps.
Regards GJ.