Unlock a world of possibilities! Login now and discover the exclusive benefits awaiting you.
- Qlik Community
- :
- All Forums
- :
- QlikView
- :
- Do we have section feature (as in Business objects...
- Subscribe to RSS Feed
- Mark Topic as New
- Mark Topic as Read
- Float this Topic for Current User
- Bookmark
- Subscribe
- Mute
- Printer Friendly Page
- Mark as New
- Bookmark
- Subscribe
- Mute
- Subscribe to RSS Feed
- Permalink
- Report Inappropriate Content
Do we have section feature (as in Business objects) in Qlikview?
Hi Gurus,
I like to thanks all the community members as i have learnt so many things regarding Qlikview here.
I have a requirement which can be easily achieved in Business objects by using "Section" feature but how can i achieve this in Qlikview?
For example:
Data is in below format:
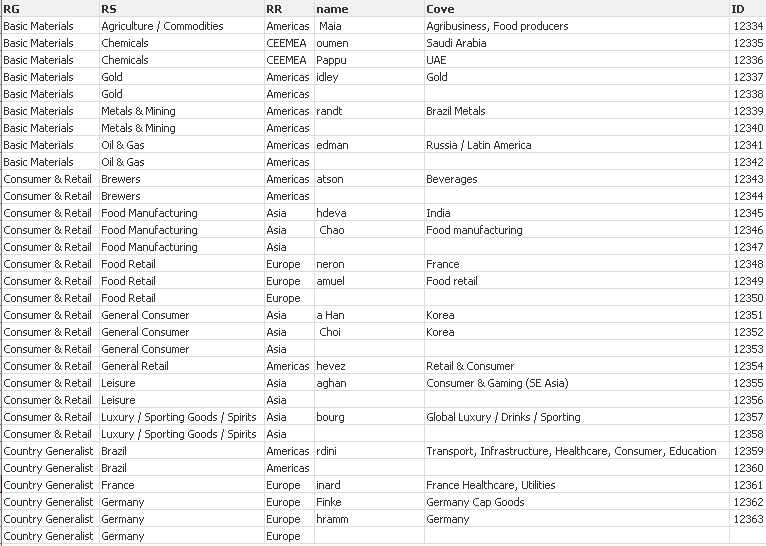
but we need data to be in below format in Qlikview.

Business object section feature
i have attached the raw data, any help is really appreciated on a high.
Thanks in advance and please let me know in case of any clarification.
- Mark as New
- Bookmark
- Subscribe
- Mute
- Subscribe to RSS Feed
- Permalink
- Report Inappropriate Content
What about a pivot table with indentation?
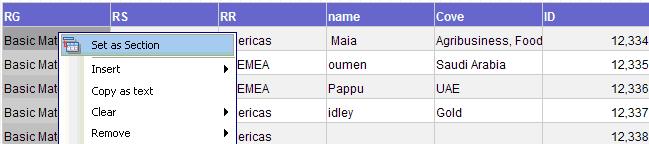
1. set the RS field as the first dimension, and add the other fields as needed
2. go to chart properties > Style > enable Indent mode
3. if needed, you can add subtotals. go to chart properties > Presentation > select the dimension and check Show Partial Sums.
Hope this helps you
Regards,
Fernando
- Mark as New
- Bookmark
- Subscribe
- Mute
- Subscribe to RSS Feed
- Permalink
- Report Inappropriate Content
Hi Fernando,
Thanks for your attempt, but sorry to say it is not matching with the format what clients required.
Regards,
Naga
- Mark as New
- Bookmark
- Subscribe
- Mute
- Subscribe to RSS Feed
- Permalink
- Report Inappropriate Content
So your client requires to create separate table charts dynamically, and group them in a hierarchy of two dimension (RG and RS), right?
Unfortunately, this is not easy done in QV, if possible at all.
There is a feature that creates dynamically charts (called Trellis), but this is only an option (available from dimension tabs) for some chart types, and not for table charts.
Maybe you can create this kind of dynamically charts using Macros, but that's quite a long way to go if you are not a Macro scripting guy, you can start off with something like discussed here:
http://community.qlik.com/message/94333
Then there is a feature called banding, but this can only used in reports (loop over a field's values and autogenerate charts).
None of these features comes close to the look and feel of the section feature within BO.
However, I think the section feature is related to a different concept, BO's Desktop / Web Intelligence are closer to a print layout then a Web layout. A section is well known from print media. QV focus on Web access and tries to use the available real estate as good as possible (but sometimes fail...)
I personally see no real advantage having sections and multiple tables instead of one pivot and maybe some list boxes for selection. But clients often require features that they are used to, not that offer the best value.
So as a summary: I think I can't help you...
- Mark as New
- Bookmark
- Subscribe
- Mute
- Subscribe to RSS Feed
- Permalink
- Report Inappropriate Content
HI Swuehl,
Thanks a lot for your truthful reply, Let me try with some macros.
Thanks and Regards,
Nagaraj
- Mark as New
- Bookmark
- Subscribe
- Mute
- Subscribe to RSS Feed
- Permalink
- Report Inappropriate Content
Hi,
I also have same requirement of sectioning.
Can you please share if you get some solution?
- Mark as New
- Bookmark
- Subscribe
- Mute
- Subscribe to RSS Feed
- Permalink
- Report Inappropriate Content
Hello,
I get the solution for sectioning charts but not for pivot table. In one of the solution they are saying of creating variable and for creating variable you need to know the no. of values of particular dimension.