Unlock a world of possibilities! Login now and discover the exclusive benefits awaiting you.

- Qlik Community
- :
- All Forums
- :
- QlikView
- :
- Re: Top results of a running competition
- Subscribe to RSS Feed
- Mark Topic as New
- Mark Topic as Read
- Float this Topic for Current User
- Bookmark
- Subscribe
- Mute
- Printer Friendly Page

- Mark as New
- Bookmark
- Subscribe
- Mute
- Subscribe to RSS Feed
- Permalink
- Report Inappropriate Content
Top results of a running competition
Hi,
I am struggling with a chart that would present the top 5 results in a running competition over the years.
I have one table (Runners) containing all the names and gender of the competitors.
Another table (Results) contains the names together with results and years for each competition.
I am not sure how to configure dimension and expression to achieve what I want.
Regards,
Mikael
- « Previous Replies
-
- 1
- 2
- Next Replies »
Accepted Solutions

 swuehl
- Mark as New
- Bookmark
- Subscribe
- Mute
- Subscribe to RSS Feed
- Permalink
- Report Inappropriate Content
Create a new field in your fact table:
LOAD
Name,
Time,
Year,
dual(Name, autonumber(Name&Year)) as TopNameDim
FROM Table;
Then use this field TopNameDim instead of Name (and leaving the other settings, dimension limits untouched).
You could also create a second expression
=Year
deselect display option 'bar' and select Text on axis.
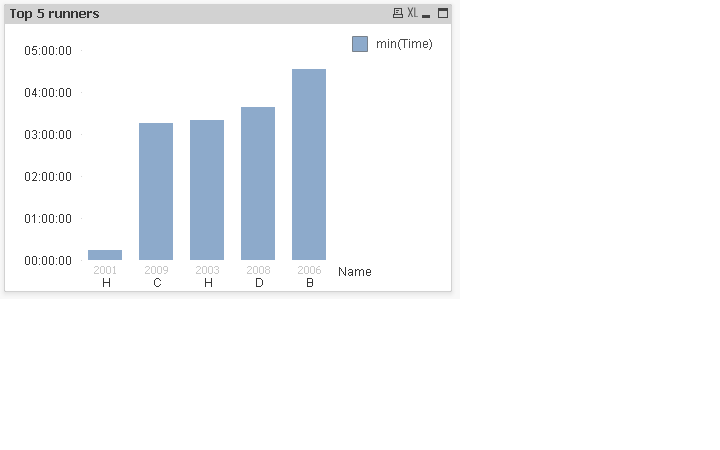
Hope this helps,
Stefan
swuehl
- Mark as New
- Bookmark
- Subscribe
- Mute
- Subscribe to RSS Feed
- Permalink
- Report Inappropriate Content
Do you want to see top 5 runners per year over top 5 over all years?
If you are using QV11, both should be pretty easy using dimension limit tab in e.g. straight table properties.
- Mark as New
- Bookmark
- Subscribe
- Mute
- Subscribe to RSS Feed
- Permalink
- Report Inappropriate Content
Hi,
I would like to have the top runner over all years presented in a bar chart starting with the fastest time.
I thought this was an easy object to set up and I started with the Name as the Dimension. However, I couldn´t see what the expression would look like. The table contains all the results for all years. One runner could be represented multiple times if they have competed more than one year.
/Mikael
- Mark as New
- Bookmark
- Subscribe
- Mute
- Subscribe to RSS Feed
- Permalink
- Report Inappropriate Content
Do you want the average position of the runner or the highest position?
- Mark as New
- Bookmark
- Subscribe
- Mute
- Subscribe to RSS Feed
- Permalink
- Report Inappropriate Content
Hi,
could you please give us an example of your data?
An xls file will be perfect.
And an example of the result you want to obtain.
Thanks a lot
- Mark as New
- Bookmark
- Subscribe
- Mute
- Subscribe to RSS Feed
- Permalink
- Report Inappropriate Content
I am looking for the fastest running times. Position is not listed in the table so it´s the fastest times that is interesting.
swuehl
- Mark as New
- Bookmark
- Subscribe
- Mute
- Subscribe to RSS Feed
- Permalink
- Report Inappropriate Content
Mikael,
if I understood your requirements correctly, you could start with dimension Name, as said.
Then use
=min(Time)
as expression to show the minimum time per Name.
Then use dimension limi tab and check 'Restrict where...' selecting 'Show only 5 smallest values'
Deselect 'Show Others' at the bottom part. You can sort by y-value in sort tab, too.
Hope this helps,
Stefan
- Mark as New
- Bookmark
- Subscribe
- Mute
- Subscribe to RSS Feed
- Permalink
- Report Inappropriate Content
Don't forget Min is a group by function so you won't see all the rows just the fastest, you may want to have
Name
Period
Min(Time)
- Mark as New
- Bookmark
- Subscribe
- Mute
- Subscribe to RSS Feed
- Permalink
- Report Inappropriate Content
Great,
Min was the function that I was looking for. However, there is still one issue with this. One of the runners should be represented twice on the top list because the has to of the fastest running times in different years. As I use Name as Dimension and "Show only 5 smallest values" she is only represented once in the top list.
Can I solve this too?
- Mark as New
- Bookmark
- Subscribe
- Mute
- Subscribe to RSS Feed
- Permalink
- Report Inappropriate Content
Set Year as another dimension as mentioned in my previous post, once you have the multiple dimensions in it should naturally split.
You could also use something like Aggr(Min(Time),Name,Year)
- « Previous Replies
-
- 1
- 2
- Next Replies »