Unlock a world of possibilities! Login now and discover the exclusive benefits awaiting you.
- Qlik Community
- :
- All Forums
- :
- QlikView
- :
- Re: Totals in Pivot Tables vs Straight Tables
- Subscribe to RSS Feed
- Mark Topic as New
- Mark Topic as Read
- Float this Topic for Current User
- Bookmark
- Subscribe
- Mute
- Printer Friendly Page
- Mark as New
- Bookmark
- Subscribe
- Mute
- Subscribe to RSS Feed
- Permalink
- Report Inappropriate Content
Totals in Pivot Tables vs Straight Tables
QV Community,
I was hoping that someone could explain the difference how totals are calculated in a pivot table vs a staight table.
My expression: ((((SUM({<STATUSKEY = >}ADHSECOUTOFADHERENCE)/60) - (SUM({<STATUSKEY = >}ADHEXCUSEDLENGTH)/60))
Okay so I have three examples. When I use the above expression in a pivot able I get a total that looks to be an average although I am summing everything. When I switch to a straight table I get the same total but I later realized that when I just so happen to export to Excel and performed an average there that the totals were different. I then realized that I can get the same total as excel when I changed the total mode to average of rows. Great! BUT I lose the functionality of a pivot table.
Can someone tell me what is happening here?
Thank you,
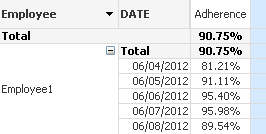
Pivot Table:
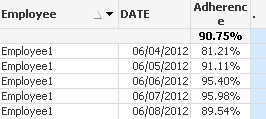
Straight Table: Total Mode Expression
Straight Tables: Total Mode: Average of Totals

Accepted Solutions
- Mark as New
- Bookmark
- Subscribe
- Mute
- Subscribe to RSS Feed
- Permalink
- Report Inappropriate Content
If you want to get the "Avg Daily Compliance" in a Pivot table, you'll need to use aggr() in your expression. For an explanation of totals in Pivot vs Straight, search the QV Help index for "aggr" and then click the link "Sum of Rows in Pivot Table". Your situation is similar to the example.
Your aggr expression would look like this:
avg(
aggr(
((((SUM({<STATUSKEY = >}ADHSECOUTOFADHERENCE)/60) - (SUM({<STATUSKEY = >}ADHEXCUSEDLENGTH)/60))
, Employee, Date
)
)
-Rob
- Mark as New
- Bookmark
- Subscribe
- Mute
- Subscribe to RSS Feed
- Permalink
- Report Inappropriate Content
The number 90.75 is Esxpression Total - as I can see it is the same in Pivot and Straight tables.
The number 90.65 is average of rows.
In the first case, the expression is calculated over all data, ignoring Dimenasions. In the second case, it is first calculated over dimensions, and after that the average is calculated.
If you ask what result is correct, the answer is - it depends on what you're looking fore. In most cases "Expression Total" makes more sense.
Regards,
Michael
- Mark as New
- Bookmark
- Subscribe
- Mute
- Subscribe to RSS Feed
- Permalink
- Report Inappropriate Content
Michael,
Thank you that makes perfect sense. One quick follow up question. You said that one makes more sense then the other. In my example I am showing adherence for an employee for a week. How would you explain the use of one over the other to a group of users?
- Mark as New
- Bookmark
- Subscribe
- Mute
- Subscribe to RSS Feed
- Permalink
- Report Inappropriate Content
When I said that the expression total makes more sense, I qualified it with "in most cases". I can't tell for sure if this is your case too, maybe in your situation "avg of total" is better.
This sort of "discrepancy" is better to explain with an example from your actual data, starting from the numbers that are included in sum.
Regards,
Michael
- Mark as New
- Bookmark
- Subscribe
- Mute
- Subscribe to RSS Feed
- Permalink
- Report Inappropriate Content
Michael,
Understandable. I appreciate your input. Now if I could just keep the functionality of the pivot table while still getting the average of totals I will be in business.
Thank you again
- Mark as New
- Bookmark
- Subscribe
- Mute
- Subscribe to RSS Feed
- Permalink
- Report Inappropriate Content
If you want to get the "Avg Daily Compliance" in a Pivot table, you'll need to use aggr() in your expression. For an explanation of totals in Pivot vs Straight, search the QV Help index for "aggr" and then click the link "Sum of Rows in Pivot Table". Your situation is similar to the example.
Your aggr expression would look like this:
avg(
aggr(
((((SUM({<STATUSKEY = >}ADHSECOUTOFADHERENCE)/60) - (SUM({<STATUSKEY = >}ADHEXCUSEDLENGTH)/60))
, Employee, Date
)
)
-Rob
- Mark as New
- Bookmark
- Subscribe
- Mute
- Subscribe to RSS Feed
- Permalink
- Report Inappropriate Content
Yes Rob, the “overarching” expression, (in this case average aggregated by Employee and Date) calculated over all data, returns the same result as in Excel.
Villegasi03, feel free to take “Correct Answer” from me and give it to Rob – I only explained the difference, while Rob modified the expression for your needs.
Regards,
Michael
- Mark as New
- Bookmark
- Subscribe
- Mute
- Subscribe to RSS Feed
- Permalink
- Report Inappropriate Content
Rob,
Thank you for your assistance.
and Michael thank you again for yours. Everything provided was very helpful.