Unlock a world of possibilities! Login now and discover the exclusive benefits awaiting you.
- Qlik Community
- :
- All Forums
- :
- QlikView
- :
- Re: Views in Charts
- Subscribe to RSS Feed
- Mark Topic as New
- Mark Topic as Read
- Float this Topic for Current User
- Bookmark
- Subscribe
- Mute
- Printer Friendly Page
- Mark as New
- Bookmark
- Subscribe
- Mute
- Subscribe to RSS Feed
- Permalink
- Report Inappropriate Content
Views in Charts
Hi all
I've an issue here. I need to do a kind of a view when I click in a part of a chart. I don't know if this is possible of being done but I hope you people with much more experience than I could help me 
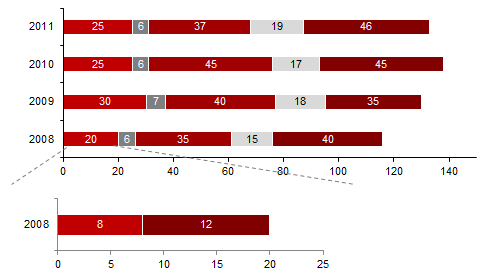
Here's a image of what I want to do:
Thanks in advance!
Best regards,
TMF
Accepted Solutions
- Mark as New
- Bookmark
- Subscribe
- Mute
- Subscribe to RSS Feed
- Permalink
- Report Inappropriate Content
So, if you activate your 'view', you want to show all segments, but detail your first segment of each bar into two segments.
Since you are using multiple expressions, this means you want to add an expression when activating the 'view', right?
In QV11, you can use conditional expression for this, and maybe a button to toggle your view. See attached sample file.
Hope this helps,
Stefan
- Mark as New
- Bookmark
- Subscribe
- Mute
- Subscribe to RSS Feed
- Permalink
- Report Inappropriate Content
You would need to use a drill down group for your dimension.
- Mark as New
- Bookmark
- Subscribe
- Mute
- Subscribe to RSS Feed
- Permalink
- Report Inappropriate Content
Thanks for answering
That would not help because the drill down changes all chart. I only want to "drill-down" in first color bar, i.e., the orange bars...
Best regards,
TMF
- Mark as New
- Bookmark
- Subscribe
- Mute
- Subscribe to RSS Feed
- Permalink
- Report Inappropriate Content
If you don't want the drill down to change other charts, you could put this chart on an alternate state (but then selections on this chart won't affect others and vice versa). I'm not sure if this would solve your problem or not.
- Mark as New
- Bookmark
- Subscribe
- Mute
- Subscribe to RSS Feed
- Permalink
- Report Inappropriate Content
Nicole,
I think that you don't understand my problem. I'll try to be more specific!
If you look at the above chart, you can see 1 dimension and 5 expressions. What I want to do is: in the first expression, when I click on it (orange bars) I want to change someway the chart, like a view. Basically, I want to show some micro data that only respects to the first expression...
I try to be more clear. Hope I'm succeded
TMF
- Mark as New
- Bookmark
- Subscribe
- Mute
- Subscribe to RSS Feed
- Permalink
- Report Inappropriate Content
HI TMF,
I do not think there is a way to do this. All the bars would finally be linked to one another. In the bar charts the bars do not stay in isolation.
thanks,
Rajesh Vaswani
- Mark as New
- Bookmark
- Subscribe
- Mute
- Subscribe to RSS Feed
- Permalink
- Report Inappropriate Content
Hi Rejesh
Thanks for your answer!
I have to find a way of doing such thing. This don't need to be done like I'm thinking. The key point is: show the micro data that is inside of one expression. If there is another way of achive that, I'll be delighted if anybody can help me on that...
Best regards,
TMF
- Mark as New
- Bookmark
- Subscribe
- Mute
- Subscribe to RSS Feed
- Permalink
- Report Inappropriate Content
So, if you activate your 'view', you want to show all segments, but detail your first segment of each bar into two segments.
Since you are using multiple expressions, this means you want to add an expression when activating the 'view', right?
In QV11, you can use conditional expression for this, and maybe a button to toggle your view. See attached sample file.
Hope this helps,
Stefan
- Mark as New
- Bookmark
- Subscribe
- Mute
- Subscribe to RSS Feed
- Permalink
- Report Inappropriate Content
Hi Stefan
Thank you for your answer. You just save my day! Let's just wait my senior likes that solution 
I don't know if the client's server will run qvw files from QV11... I hope so!
Thanks a lot again.
Kind regards,
TMF