Unlock a world of possibilities! Login now and discover the exclusive benefits awaiting you.
- Qlik Community
- :
- All Forums
- :
- QlikView
- :
- Re: A Simple "count()" Chart With A Date Dilemma
- Subscribe to RSS Feed
- Mark Topic as New
- Mark Topic as Read
- Float this Topic for Current User
- Bookmark
- Subscribe
- Mute
- Printer Friendly Page
- Mark as New
- Bookmark
- Subscribe
- Mute
- Subscribe to RSS Feed
- Permalink
- Report Inappropriate Content
A Simple "count()" Chart With A Date Dilemma
So we have three fields in this one system - an order ID, a start date and an end date.
| Order ID | Requested Date | Completed Date |
|---|---|---|
| 65498 | 5/1/2013 12:24:16 PM | 5/13/2013 5:02:22 AM |
| 49846 | 3/14/2013 3:35:21 AM | 3/27/2013 6:32:17 PM |
| 61385 | 4/12/2013 7:08:54 PM | 4/21/2013 10:52:02 AM |
What we need to get is a rolling chart of how many orders were submitted in a week and how many were completed in that same week. With the dimension of
=date(WeekStart(REQUESTED_DATE,0,0),'MMM-D')
I can get the following chart but obviously this means nothing:
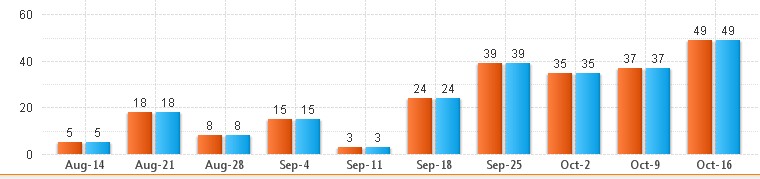
Any idea on how to solve this problem?
- Tags:
- new_to_qlikview
- Mark as New
- Bookmark
- Subscribe
- Mute
- Subscribe to RSS Feed
- Permalink
- Report Inappropriate Content
Maybe like attached (using CROSSTABLE LOAD and set analysis)?
- Mark as New
- Bookmark
- Subscribe
- Mute
- Subscribe to RSS Feed
- Permalink
- Report Inappropriate Content
My apologies for the late response, but my actual table has 47 fields, and crosstables don't seem to play well with large tables unless I'm doing it wrong. The original load statement I'm working with is below. The three aforementioned fields I need are still the same (Order ID, Requested/Completed date). If crosstable won't work with the amount of fields in his table, perhaps there's another way?
Q_JEM:
LOAD
*,
AutoNumber(ORDER_ID & '-' & COLOR_ID) as ORDERKEY,
AutoNumber(COLOR_ID & '-' & STATUS) as StatusKey,
AutoNumber(COLOR_ID & '-' & SYSTEM_NAME) as SystemKey,
If(ADD_DATE>Today()-14,1,0) as IDLE_ORDER;
SQL SELECT *
FROM Oracle5.Q_JEM
where
(COLOR_ID=3 OR COLOR_ID=22 OR COLOR_ID=63 OR COLOR_ID=1 OR COLOR_ID=74)
and
(STATE != 0 AND STATE != 11)
and
(STATUS != 'Cancelled' and STATUS != 'Refunded')
and
(DEPT='EMR' or DEPT='Logst' or DEPT='Development' or DEPT='OSC')
and
(ADD_DATE>=(sysdate-730))
;