Unlock a world of possibilities! Login now and discover the exclusive benefits awaiting you.
- Qlik Community
- :
- All Forums
- :
- QlikView
- :
- Re: Need Help : Timeline
- Subscribe to RSS Feed
- Mark Topic as New
- Mark Topic as Read
- Float this Topic for Current User
- Bookmark
- Subscribe
- Mute
- Printer Friendly Page
- Mark as New
- Bookmark
- Subscribe
- Mute
- Subscribe to RSS Feed
- Permalink
- Report Inappropriate Content
Need Help : Timeline
Hello,
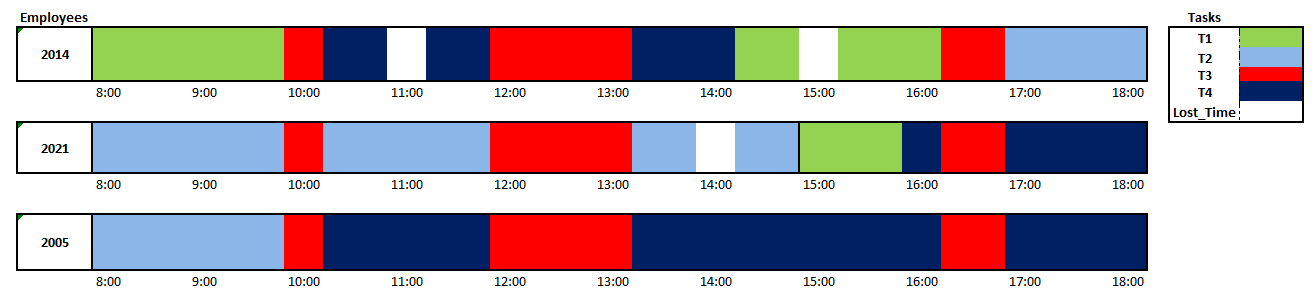
I want to produce a timeline showing me the tasks performed by each employee during a work day.
This will allow me to see the untapped time.
The end result should look like the graph below:
My data is as follows (see example attached):
| Task_ID | Task_Desc | Task_Start_Time | Task_End_Time | Task_Duration | Employee_ID |
| 100 | T1 | 6/02/2014 11:34 | 6/02/2014 11:36 | 0:02:09 | 1011 |
I tried so many graphics without getting the result I want anyone have an idea? .
In advance thank you!
Accepted Solutions
- Mark as New
- Bookmark
- Subscribe
- Mute
- Subscribe to RSS Feed
- Permalink
- Report Inappropriate Content
Marwen,
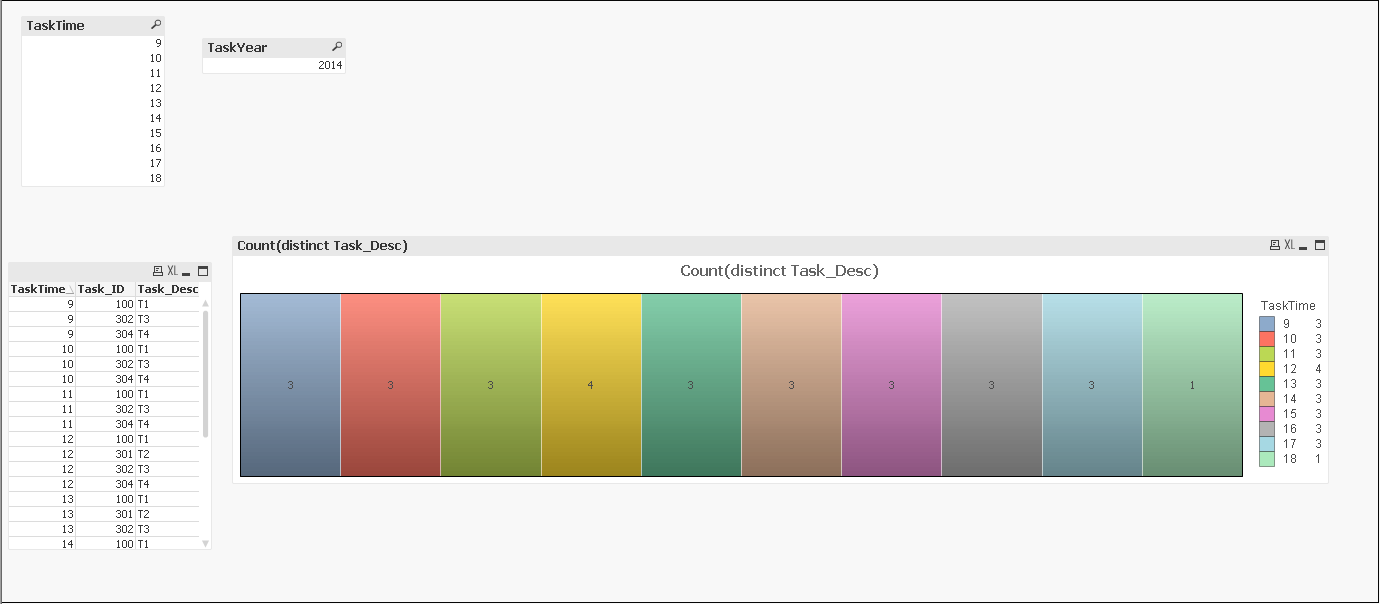
If I were you I would try to use the funnel chart, and tweak it here and there.
I have assembled an example with your data. The issue I am facing is that you have got several task-desc for each hour, which is not the case in your image, you would need to tackle this.
Best,
Jerome Couzy
- Mark as New
- Bookmark
- Subscribe
- Mute
- Subscribe to RSS Feed
- Permalink
- Report Inappropriate Content
Marwen,
If I were you I would try to use the funnel chart, and tweak it here and there.
I have assembled an example with your data. The issue I am facing is that you have got several task-desc for each hour, which is not the case in your image, you would need to tackle this.
Best,
Jerome Couzy
- Mark as New
- Bookmark
- Subscribe
- Mute
- Subscribe to RSS Feed
- Permalink
- Report Inappropriate Content
The employee can't do many tasks in the same time, The Data that i shared was just for exemple but in the reality this is not a big problem.
I'll Try this !
Thanks
- Mark as New
- Bookmark
- Subscribe
- Mute
- Subscribe to RSS Feed
- Permalink
- Report Inappropriate Content
That's what I thought 
In this case you're gonna be able to use the function Only() to evaluate the ID of the task or name or whatever to display it correctly. This function does only work when 1 single value is returned.
Keep me posted 
Cheers,
Jerome Couzy
- Mark as New
- Bookmark
- Subscribe
- Mute
- Subscribe to RSS Feed
- Permalink
- Report Inappropriate Content
Marwen,
Did you sort this out? Did it help?
Jerome