Unlock a world of possibilities! Login now and discover the exclusive benefits awaiting you.
- Qlik Community
- :
- All Forums
- :
- QlikView
- :
- Inner pie chart
- Subscribe to RSS Feed
- Mark Topic as New
- Mark Topic as Read
- Float this Topic for Current User
- Bookmark
- Subscribe
- Mute
- Printer Friendly Page
- Mark as New
- Bookmark
- Subscribe
- Mute
- Subscribe to RSS Feed
- Permalink
- Report Inappropriate Content
Inner pie chart
Hi,
I have to create a pie chart with 2 dimensions so that pie chart will have inner and outer circle and I have to display data points as well.

Here, Therapeutic Area and Disease are the dimensions.
And I want for inner circle either the value will be shown accumulated or not shown.
And I do not want to go for layering concept.
Please help.
Thanks in advance.
- « Previous Replies
-
- 1
- 2
- Next Replies »
Accepted Solutions
- Mark as New
- Bookmark
- Subscribe
- Mute
- Subscribe to RSS Feed
- Permalink
- Report Inappropriate Content
Hi,
I don't think the way you want the pie chart to be displayed is possible.
As far as I know data value points can either be shown for both the dimensions or can be disabled for both.
- Mark as New
- Bookmark
- Subscribe
- Mute
- Subscribe to RSS Feed
- Permalink
- Report Inappropriate Content
Can you provide sample data file?
- Mark as New
- Bookmark
- Subscribe
- Mute
- Subscribe to RSS Feed
- Permalink
- Report Inappropriate Content
Hi Manish,
- Mark as New
- Bookmark
- Subscribe
- Mute
- Subscribe to RSS Feed
- Permalink
- Report Inappropriate Content
Hi Aakansha,
Might be something like attached.
- Mark as New
- Bookmark
- Subscribe
- Mute
- Subscribe to RSS Feed
- Permalink
- Report Inappropriate Content
Hi,
Take pie chart
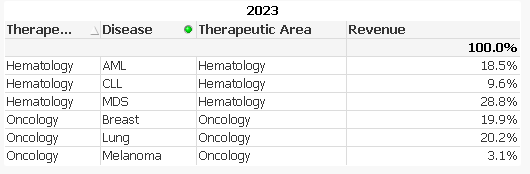
Dimension1: Theraupatic_Area
Dimension2: Disease
Expresion :- Sum(Revenue)
and in properties -> Number -> set Fixed to 1 Decimal and select Show in Percentage%
Hope this helps
Thanks & Regards
- Mark as New
- Bookmark
- Subscribe
- Mute
- Subscribe to RSS Feed
- Permalink
- Report Inappropriate Content
Hi Anand,
I want that values which are displaying in inner circle either to add up and then shown or not shown at all, only values in outer to be dispalyed.
- Mark as New
- Bookmark
- Subscribe
- Mute
- Subscribe to RSS Feed
- Permalink
- Report Inappropriate Content
No, I want that values which are displaying in inner circle either to add up and then shown or not shown at all, only values in outer to be dispalyed
- Mark as New
- Bookmark
- Subscribe
- Mute
- Subscribe to RSS Feed
- Permalink
- Report Inappropriate Content
So, you don't want them to be distributed on the basis of second dimension i.e. "Theraupatic Area"?
- Mark as New
- Bookmark
- Subscribe
- Mute
- Subscribe to RSS Feed
- Permalink
- Report Inappropriate Content
Hi,
I don't want data value points of therapeutic area to be distributed as it is shown.
- Mark as New
- Bookmark
- Subscribe
- Mute
- Subscribe to RSS Feed
- Permalink
- Report Inappropriate Content
Then instead of Theraupautic Area as a dimension, try using a calculated dimension as =Sum(TOTAL Theraupautic_Area)
- « Previous Replies
-
- 1
- 2
- Next Replies »