Unlock a world of possibilities! Login now and discover the exclusive benefits awaiting you.
- Qlik Community
- :
- All Forums
- :
- QlikView
- :
- How to Create Bullet Charts / Graphs
- Subscribe to RSS Feed
- Mark Topic as New
- Mark Topic as Read
- Float this Topic for Current User
- Bookmark
- Subscribe
- Mute
- Printer Friendly Page
- Mark as New
- Bookmark
- Subscribe
- Mute
- Subscribe to RSS Feed
- Permalink
- Report Inappropriate Content
How to Create Bullet Charts / Graphs
Hi All,
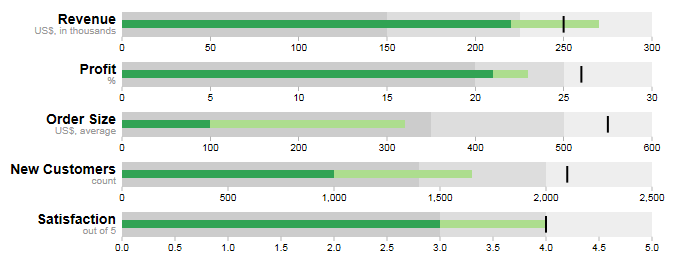
Can I know does QlikView support to make a bullet chart / graphs like below? How to create it?
Thank you, All
- Mark as New
- Bookmark
- Subscribe
- Mute
- Subscribe to RSS Feed
- Permalink
- Report Inappropriate Content
There are a number of steps involved. First you have to create a gauge chart.
orientation : horizontal
Do the gauge settings now:
Max: Usually 120% of your expression. e.g. Sum(Revenue) *1.2
Indicator, Model
Show Needle
Style
Line
Switch of autowidth segments
Hide Segment boundaries, Gauge Outlines
Create 3 segments or more
Segment1 lower bound => 0.0
2 lower => 0.5
3 => 0.9
give relevant colors
Finish
- Mark as New
- Bookmark
- Subscribe
- Mute
- Subscribe to RSS Feed
- Permalink
- Report Inappropriate Content
Now add a new Bar chart
no dimension, but add your expression sum(Revenue)
Orientation : Horizontal
Forced 0
Hide Axis both switched on
static max again 120% of your measure
goto color, set transparency to 100%
Layout tab: set shadow to No shadow
border width to 0
layer should be Top
caption turned off
finish
Emboss bar chart over Gauge chart.
Job done.