Unlock a world of possibilities! Login now and discover the exclusive benefits awaiting you.
- Qlik Community
- :
- All Forums
- :
- QlikView
- :
- Help with dates and a graph!!
- Subscribe to RSS Feed
- Mark Topic as New
- Mark Topic as Read
- Float this Topic for Current User
- Bookmark
- Subscribe
- Mute
- Printer Friendly Page
- Mark as New
- Bookmark
- Subscribe
- Mute
- Subscribe to RSS Feed
- Permalink
- Report Inappropriate Content
Help with dates and a graph!!
Hi everybody.
I'll atach a very simple example of what i have to do. I have propertys, the money of the rental and the date of the rental.
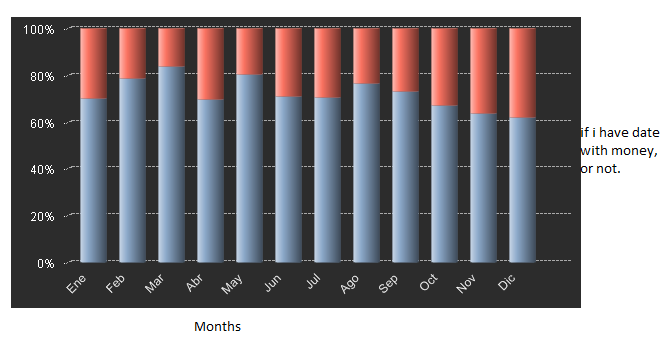
I have to show with all the months as a dimension in what months the renter payed and in what months didnt pay.
If i don't have date and money the renter didn't pay. If i have date and money the renter payed.
I have to show this in %. For example if the renter payed all the months i have all blue, if not i have a part in red color ,etc.
The first problem is that i don't have dates for the months that the renter didn't pay, i've been trying to use some thing but they aren't working.
I read an article with variables, but sometimes i don't have the last date to do a max - min, because i don't have the last months.
Thank you!!
- Mark as New
- Bookmark
- Subscribe
- Mute
- Subscribe to RSS Feed
- Permalink
- Report Inappropriate Content
Maybe like attached qvw.
talk is cheap, supply exceeds demand