Unlock a world of possibilities! Login now and discover the exclusive benefits awaiting you.
- Qlik Community
- :
- All Forums
- :
- QlikView
- :
- Add Rows on Pivot Tables
- Subscribe to RSS Feed
- Mark Topic as New
- Mark Topic as Read
- Float this Topic for Current User
- Bookmark
- Subscribe
- Mute
- Printer Friendly Page
- Mark as New
- Bookmark
- Subscribe
- Mute
- Subscribe to RSS Feed
- Permalink
- Report Inappropriate Content
Add Rows on Pivot Tables
I need this format on my pivot table.
I have a relation of Division-->Group-->Company
I have values of company, group totals, division totals and percentage already loaded as results but they are on columns and I want the pivot table to stay in those 3 columns size but scrolling down, showing result of group totals, division totals and percentage under the last column. (Column 3)
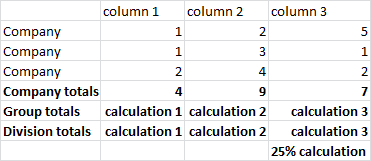
How can I get to move those 3 rows (group totals, division totals and percentage) under the company totals??
It looks like qlikview does not allow to add rows so what can I do?
- Tags:
- new_to_qlikview
- Mark as New
- Bookmark
- Subscribe
- Mute
- Subscribe to RSS Feed
- Permalink
- Report Inappropriate Content
You will need another table with this 3 rows. The dimension of this table you can create with a Valuelist.
In the attachment you will find a sample of using a Valuelist.
- Mark as New
- Bookmark
- Subscribe
- Mute
- Subscribe to RSS Feed
- Permalink
- Report Inappropriate Content
I tried using Valuelist but I can't show that table format that I want. Maybe there's something missing that I'm not doing well. I can create the table with valuelist but what do I do next??
I tried on the script editor:
AddRowTable:
LOAD * Inline [Company Totals,Group Totals, Division Totals, Percentage (blank row for the percentage)];
How do I combine it into the pivot table? with a Join?
- Mark as New
- Bookmark
- Subscribe
- Mute
- Subscribe to RSS Feed
- Permalink
- Report Inappropriate Content
Sorry but I can't figure out how to do this!!! Please I need help!

I have the following script:
Division:
LOAD IDDivision, NombreDivision as División;
SQL SELECT *
FROM "Divisiones";
Companias:
LOAD IDCompania, IDDivision, NombreCompania AS Compañía, IDGrupo, SecuenciaListado, Desactivada;
SQL SELECT *
FROM "Companias"
WHERE Desactivada = 0
ORDER BY SecuenciaListado, IDCompania;
Grupo:
LOAD IDGrupo, NombreGrupo as Grupo;
SQL SELECT *
FROM "Grupos";
Calendario:
LOAD date(FechaAListar,'DD/MM/YYYY') as [Fecha de Venta],
date(FechaMisma,'DD/MM/YYYY') as [Fecha Anterior Actual],
date(FechaAComparar,'DD/MM/YYYY') as [Fecha Anterior Siguiente];
SQL SELECT FechaAListar, FechaMisma, FechaAComparar
FROM "CalendariodeFechas"
WHERE YEAR(FechaAListar) >= 2010
ORDER BY FechaAListar DESC;
DetalleVentas:
LOAD IDCompania,
date(FechaVenta,'DD/MM/YYYY') as [Fecha de Venta],
VentaDelDia as [Ventas del Dia],
PromedioDelDia as [Promedio Anual del Dia];
SQL SELECT IDCompania, FechaVenta, VentaDelDia, PromedioDelDia
FROM "Detalle Ventas del Dia"
WHERE YEAR(FechaVenta) >= 2010
ORDER BY FechaVenta DESC;
I only have one calender object for selecting date of sale (Fecha de Venta).
I need the exact following format:
|Compania| |columnlabel1| |columnlabel2| |columnlabel3| |columnlabel4|
|NombreCompania| |number1| |number2| |number3| |number4|
|NombreCompania| |number1| |number2| |number3| |number4|
|NombreCompania| |number1| |number2| |number3| |number4|
|NombreGrupo| |calculation1| |calculation2| |calculation3| |calculation4|
%percentage3 %percentage6
|Mensual Grupo| |calculation1| |calculation2| |calculation3| |calculation4|
%percentage3 %percentage6%
|NombreCompania| |number1| |number2| |number3| |number4|
|NombreCompania| |number1| |number2| |number3| |number4|
|NombreCompania| |number1| |number2| |number3| |number4|
|NombreGrupo| |calculation1| |calculation2| |calculation3| |calculation4|
%percentage3 %percentage6%
|Mensual Grupo| |calculation1| |calculation2| |calculation3| |calculation4|
%percentage3 %percentage6%
|NombreDivision| |calculation1| |calculation2| |calculation3| |calculation4|
|Mensual Division| |calculation1| |calculation2| |calculation3| |calculation4|
%percentage3 %percentage6%
I hope I make it clear enough.
I thought creating a straight table from scratch using script editor. Maybe I'm getting close...
Somebody help! It will help me and other QV developers  Gratitud.