Unlock a world of possibilities! Login now and discover the exclusive benefits awaiting you.

- Qlik Community
- :
- All Forums
- :
- QlikView
- :
- Re: show hide chart on behalf of list box values
- Subscribe to RSS Feed
- Mark Topic as New
- Mark Topic as Read
- Float this Topic for Current User
- Bookmark
- Subscribe
- Mute
- Printer Friendly Page

 qliklearnervir
- Mark as New
- Bookmark
- Subscribe
- Mute
- Subscribe to RSS Feed
- Permalink
- Report Inappropriate Content
show hide chart on behalf of list box values
Hi ,
In our requirement i have one list box called 'business' and values called 'generic' and 'safety' .
on behalf of generic i want to show charts and on behalf of safety another chart in same sheet.
kindly guide how to conditionally i can do this scenario.
Thanks.
Virendra

- Mark as New
- Bookmark
- Subscribe
- Mute
- Subscribe to RSS Feed
- Permalink
- Report Inappropriate Content
Hi,
You can write in expression sett analysis.
Chart1:
In dimension,
Fieldname
In Expression,
Sum({<business={'generic'} >} value_field)
Chart2:
In dimension,
Fieldname
In Expression,
Sum({<business={'safety'} >} value_field)

 sunny_talwar
- Mark as New
- Bookmark
- Subscribe
- Mute
- Subscribe to RSS Feed
- Permalink
- Report Inappropriate Content
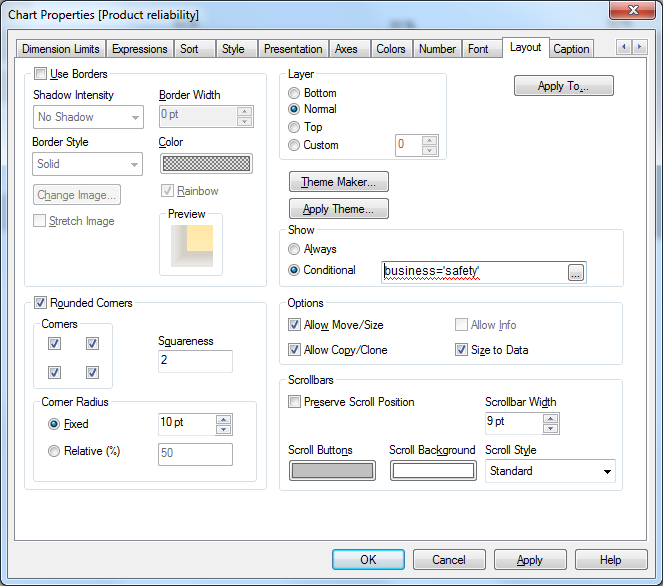
You can use this in your chart's conditional show expression:
GetFieldSelections(business) = 'generic' for 1st chart and
GetFieldSelections(business) = 'safety' for 2nd chart
HTH
Best,
Sunny


 stigchel
- Mark as New
- Bookmark
- Subscribe
- Mute
- Subscribe to RSS Feed
- Permalink
- Report Inappropriate Content
You can conditionally show or hide objects, in the properties layout tab set conditional show and an expression.