Unlock a world of possibilities! Login now and discover the exclusive benefits awaiting you.
- Qlik Community
- :
- Forums
- :
- Analytics
- :
- App Development
- :
- Re: Grouping data by measurement and draw multiple...
- Subscribe to RSS Feed
- Mark Topic as New
- Mark Topic as Read
- Float this Topic for Current User
- Bookmark
- Subscribe
- Mute
- Printer Friendly Page
- Mark as New
- Bookmark
- Subscribe
- Mute
- Subscribe to RSS Feed
- Permalink
- Report Inappropriate Content
Grouping data by measurement and draw multiple line graph
Hi all,
I'm new to Qlik Sense. I've data in mongodb. I managed to load data via qvsource.Now, I've data like this.
Name Time Value
| Sig0 | 1434443400061 | 0.78535046693984389 |
| Sig0 | 1434365571861 | 0.47410865876843988 |
| Sig0 | 1434367800061 | 0.52816115795111507 |
| Sig1 | 1434443400062 | 0.54981022370331589 |
| Sig1 | 1434365571862 | 0.48053196850949664 |
| Sig1 | 1434367800062 | 0.28258334531262386 |
Now, i wanted to draw a line graph with
X-Axis -> Time (in local date time)
Y-Axis -> two lines for Sig0, Sig1 and values should plot corresponding to time.
How can i achieve this?
Edit:
sunindia gave a solution which looks promising with Qlik View but i need help with Qlik Sense.
- Tags:
- line chart
- qlik sense
- « Previous Replies
-
- 1
- 2
- Next Replies »
- Mark as New
- Bookmark
- Subscribe
- Mute
- Subscribe to RSS Feed
- Permalink
- Report Inappropriate Content
I guess add Time and Name as dimension (in the mentioned order) and use Sum(Value) or Avg(Value) as your expression and it should give you what you are looking for.
Best,
Sunny
- Mark as New
- Bookmark
- Subscribe
- Mute
- Subscribe to RSS Feed
- Permalink
- Report Inappropriate Content
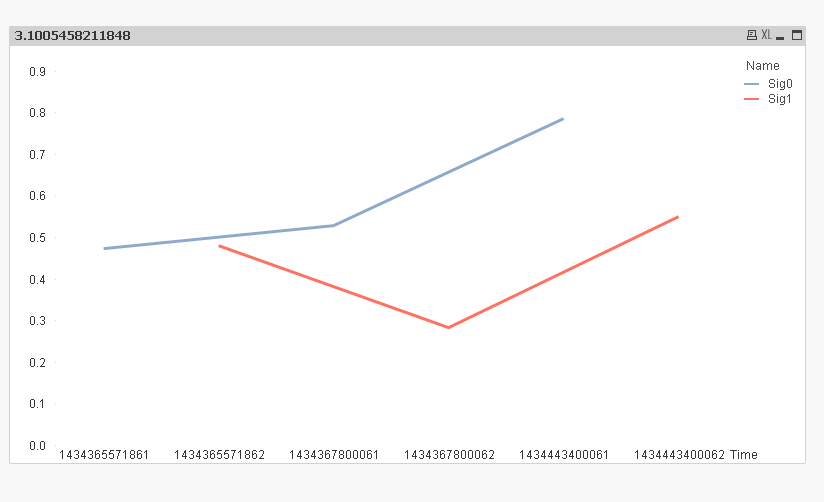
Something like this?
- Mark as New
- Bookmark
- Subscribe
- Mute
- Subscribe to RSS Feed
- Permalink
- Report Inappropriate Content
Hi sunindia,
Your snap looks like what i need. can you tell me how to open your .qvw file?
FYI,
I'm using Qlik Sense not Qlik View
Appreciate your support.
- Mark as New
- Bookmark
- Subscribe
- Mute
- Subscribe to RSS Feed
- Permalink
- Report Inappropriate Content
I didn't know you were using Sense, I don't think you will be able to open qvw unless you have QlikView. Regardless the idea is to create a chart with Time (1st Dimension) and Name (2nd Dimension) as Dimensions and expression would be Sum/Avg/Max/Min(Value) based on your requirement.
HTH
Best,
Sunny
- Mark as New
- Bookmark
- Subscribe
- Mute
- Subscribe to RSS Feed
- Permalink
- Report Inappropriate Content
sunindia I understood. Can you tell me how exactly handle measurement (value) with combination of another measurement(Name) with respect to time?
is it possible to paste piece of code you used to get that part of drawing logic (Expression in Qlik Sense), if its is a text?
- Mark as New
- Bookmark
- Subscribe
- Mute
- Subscribe to RSS Feed
- Permalink
- Report Inappropriate Content
I am not sure what you are trying to ask? Can you explain it a little more?
Best,
Sunny
- Mark as New
- Bookmark
- Subscribe
- Mute
- Subscribe to RSS Feed
- Permalink
- Report Inappropriate Content
sunindia Since you are using QlikView and I'm using QlikView Personal Edition( I'm not able to open a document created using another user's personal edition), I'm trying to understand how to create same at my side using Qlik view Personal Edition or Qlik Sense.
If you can explain me how you created that .qvw file, i wanted to create same at my side.
Hope i'm clear.
- Mark as New
- Bookmark
- Subscribe
- Mute
- Subscribe to RSS Feed
- Permalink
- Report Inappropriate Content
Here are the screenshots:
1) Add Time and Name as your dimension
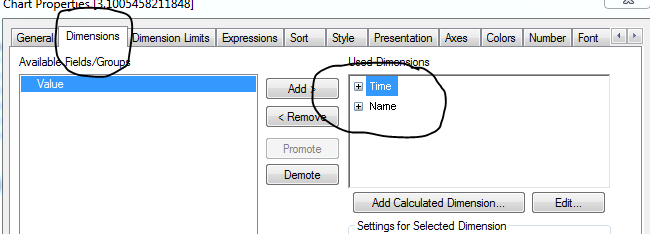
2) Add an expression: I am using Sum(Value)
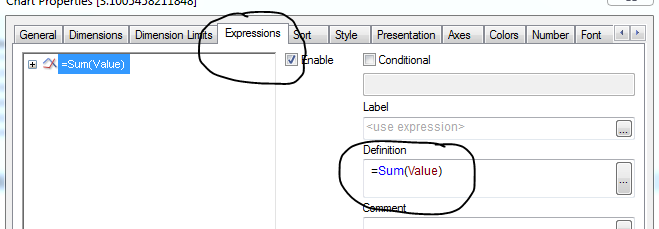
Does this help clarify things? I hope this will help 
Best,
Sunny
- Mark as New
- Bookmark
- Subscribe
- Mute
- Subscribe to RSS Feed
- Permalink
- Report Inappropriate Content
Hi Prasad,
Go to the sheet in Qlik Sense,
Drag out a line chart
Drag out the field Time and choose Add "Time"
Drag out the field Name and choose Add "Name"
Drag out the field Value and choose Add as measure and then the option Sum
Then to make it look better you can go into the propert panel on the right hand side and Appearance->Presentation you choose to have missing values represented as connections.
- « Previous Replies
-
- 1
- 2
- Next Replies »