Unlock a world of possibilities! Login now and discover the exclusive benefits awaiting you.
- Qlik Community
- :
- Forums
- :
- Analytics
- :
- App Development
- :
- Re: QS chart does it have line chart with allow 2 ...
- Subscribe to RSS Feed
- Mark Topic as New
- Mark Topic as Read
- Float this Topic for Current User
- Bookmark
- Subscribe
- Mute
- Printer Friendly Page
- Mark as New
- Bookmark
- Subscribe
- Mute
- Subscribe to RSS Feed
- Permalink
- Report Inappropriate Content
QS chart does it have line chart with allow 2 diamension
Hi All
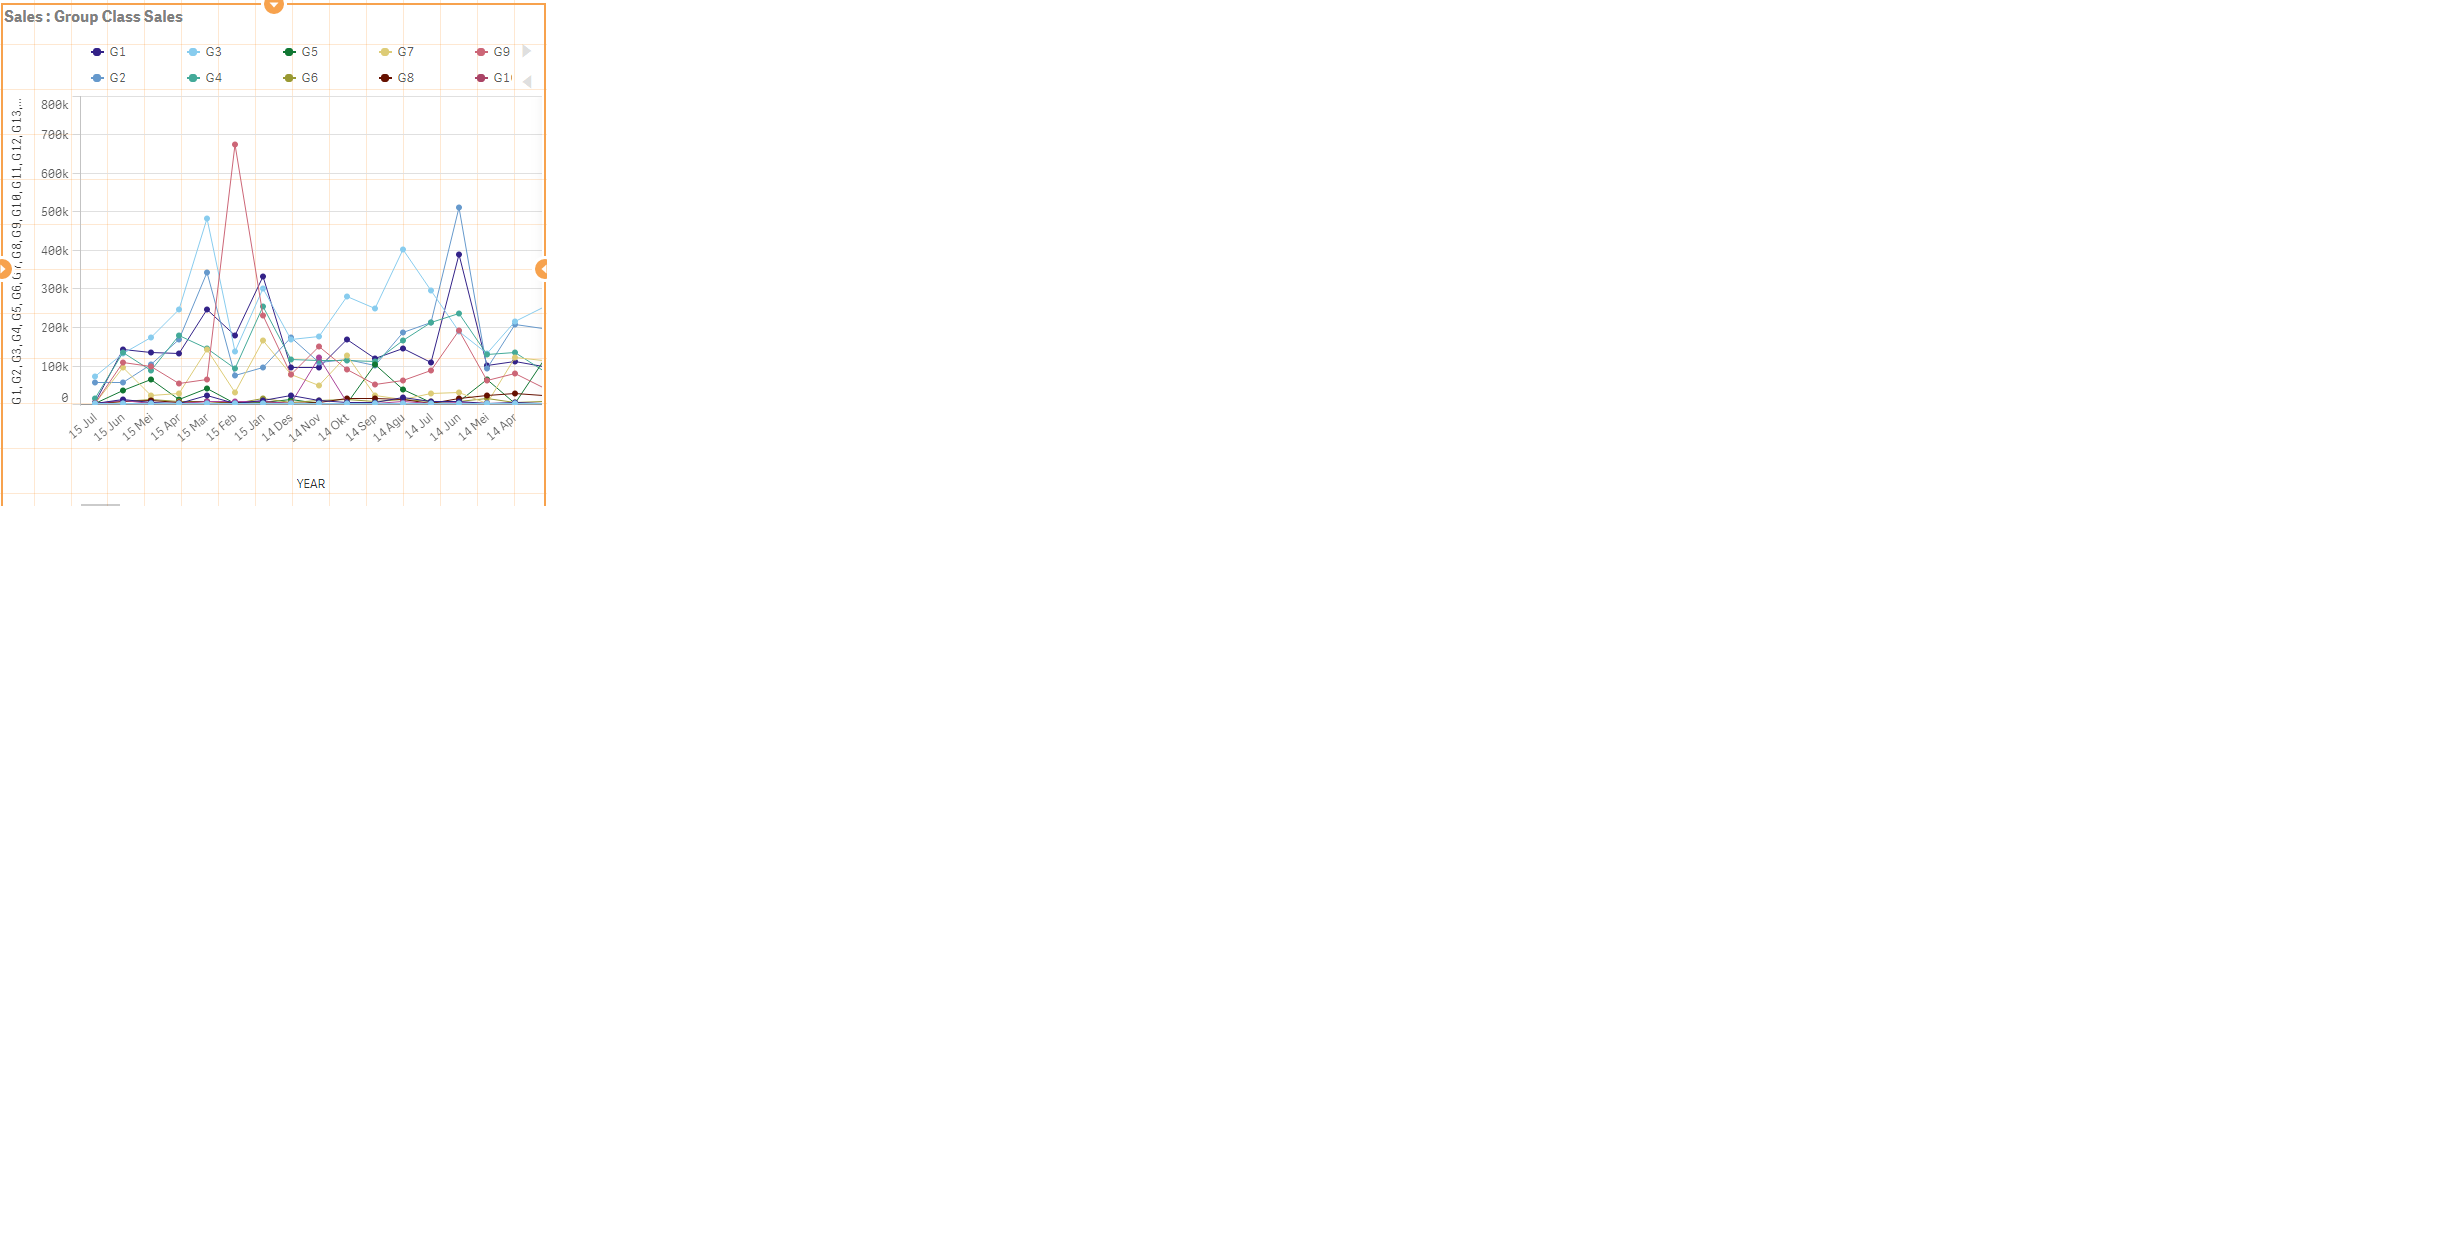
I need to plot line chart by SBU by period like below , when i select QS line chart , it does not allow me to add one more diamension for GROUP_CLASS , ( Below chart i create 10 expression for each GROUP_CLASS , which is not correct way ) , Hope some one can suggest me work around.
Accepted Solutions
- Mark as New
- Bookmark
- Subscribe
- Mute
- Subscribe to RSS Feed
- Permalink
- Report Inappropriate Content
That's not a line chart. It's a combo chart. In Qlik Sense a combo chart can have only one dimension.
talk is cheap, supply exceeds demand
- Mark as New
- Bookmark
- Subscribe
- Mute
- Subscribe to RSS Feed
- Permalink
- Report Inappropriate Content
You can use two dimensions in a line chart, but only with one measure, A line chart with two (or more dimensions) and two (or more) measures doesn't make sense anyway.
talk is cheap, supply exceeds demand
- Mark as New
- Bookmark
- Subscribe
- Mute
- Subscribe to RSS Feed
- Permalink
- Report Inappropriate Content
Hi Gysbert
May be you mis-understand my question , i refer to Qlik Sense. And i believe you are refer to Qlik View line chart right ?
Paul
- Mark as New
- Bookmark
- Subscribe
- Mute
- Subscribe to RSS Feed
- Permalink
- Report Inappropriate Content
No, I refer to Qlik Sense.
talk is cheap, supply exceeds demand
- Mark as New
- Bookmark
- Subscribe
- Mute
- Subscribe to RSS Feed
- Permalink
- Report Inappropriate Content
Hi Gysbert
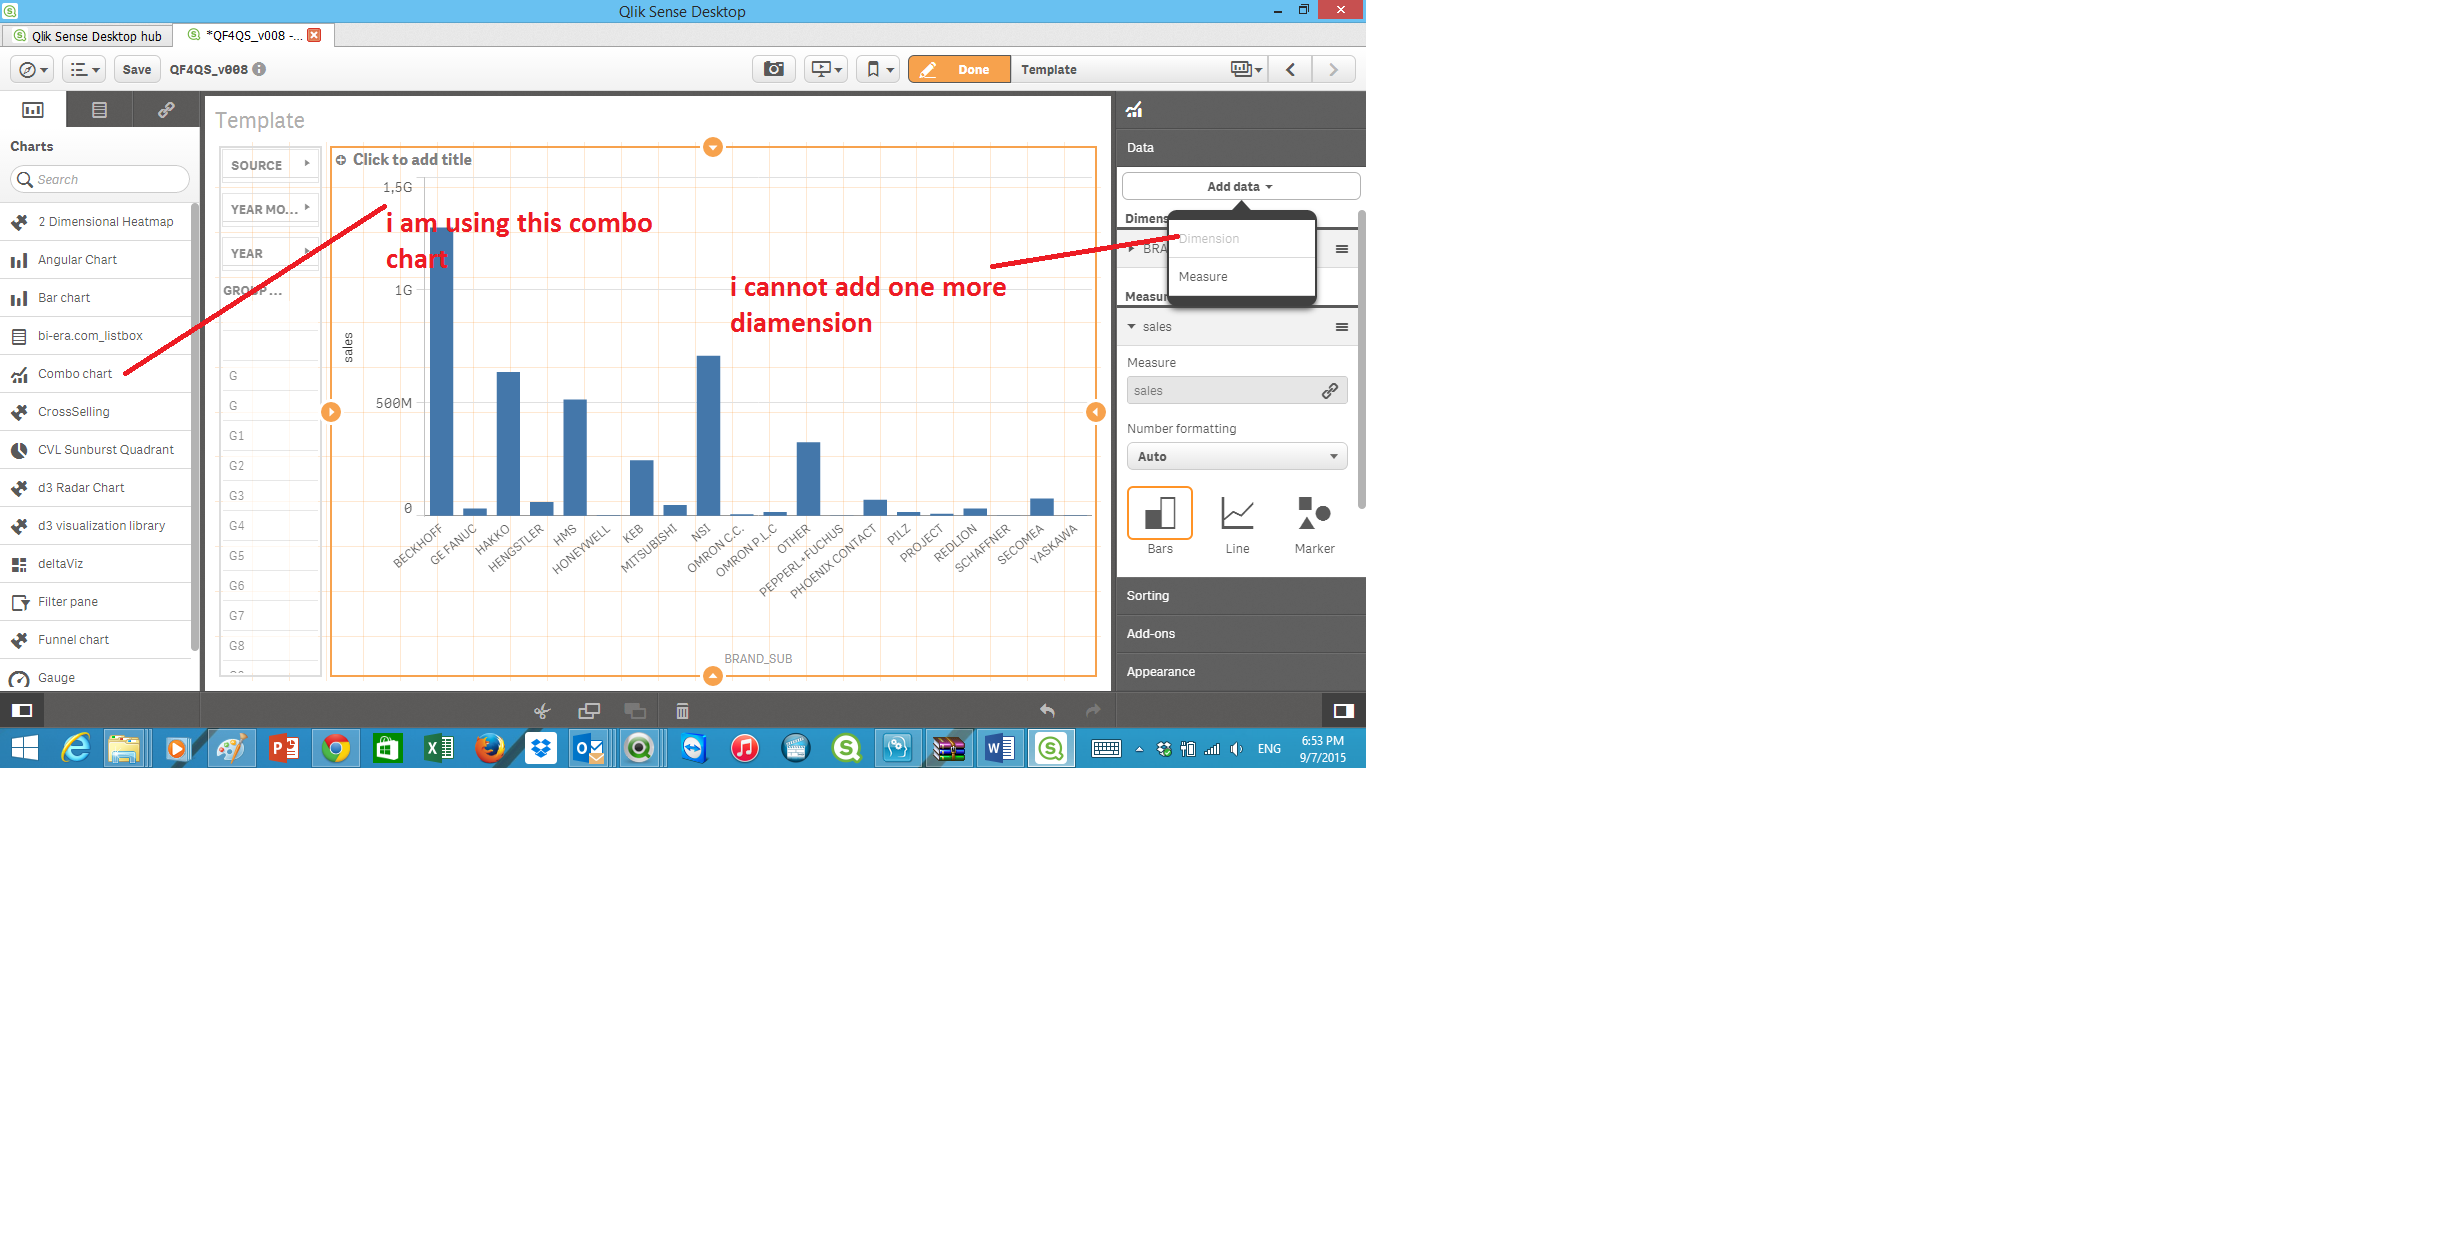
Great that you are ref to QS , kindly see below screen shot , i am not able add the dimension.
- Mark as New
- Bookmark
- Subscribe
- Mute
- Subscribe to RSS Feed
- Permalink
- Report Inappropriate Content
That's not a line chart. It's a combo chart. In Qlik Sense a combo chart can have only one dimension.
talk is cheap, supply exceeds demand
- Mark as New
- Bookmark
- Subscribe
- Mute
- Subscribe to RSS Feed
- Permalink
- Report Inappropriate Content
Hi Gysbert
Thank you not working fine.
Paul