Unlock a world of possibilities! Login now and discover the exclusive benefits awaiting you.
- Qlik Community
- :
- All Forums
- :
- QlikView
- :
- Re: Using MonthEnd in If Statement
- Subscribe to RSS Feed
- Mark Topic as New
- Mark Topic as Read
- Float this Topic for Current User
- Bookmark
- Subscribe
- Mute
- Printer Friendly Page
- Mark as New
- Bookmark
- Subscribe
- Mute
- Subscribe to RSS Feed
- Permalink
- Report Inappropriate Content
Using MonthEnd in If Statement
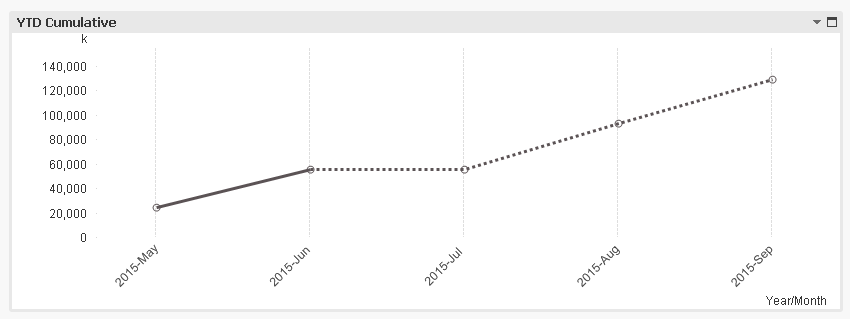
I have a graph (attached) that shows Actuals in a solid line and then turns into a dotted line for Forecasted hours.
The actuals get posted on the last day of the month so since it is currently July, I would expect to see the solid line end in June. Instead, it's showing through the end of this month. I tried to overcome this by using:
Dimension: =date(FISCAL_MONTH_YEAR, 'YYYY-MMM')
Expression: if(FISCAL_MONTH_YEAR>Monthend(today())+1,sum(FCST_AMT),sum(ACT_AMT))
Line Style: if([FISCAL_MONTH_YEAR]>today(),'<S3>','<S1>')
Even though the dotted line is starting in August now, my July date has disappeared. which shouldn't be the case.
How do I get the current month to display but the dotted line starting from the last month?
Thanks,
Cassandra
- « Previous Replies
-
- 1
- 2
- Next Replies »
- Mark as New
- Bookmark
- Subscribe
- Mute
- Subscribe to RSS Feed
- Permalink
- Report Inappropriate Content
Check it out:
New Expression (With no accumulation)
If(Sum(ACT_AMT) > 0 or Sum(FCST_AMT) > 0,
RangeSum(Above(TOTAL If(FISCAL_MONTH_YEAR <= Monthend(Today()), Sum(ACT_AMT), Sum(FCST_AMT)), 0, RowNo())))
- Mark as New
- Bookmark
- Subscribe
- Mute
- Subscribe to RSS Feed
- Permalink
- Report Inappropriate Content
You are amazing! Is it necessary/correct to have No Accumulation?
The intent of this chart is to show Actuals historically and Forecast for the future.
- Mark as New
- Bookmark
- Subscribe
- Mute
- Subscribe to RSS Feed
- Permalink
- Report Inappropriate Content
Not necessary, but you will see double accumulation if you have it selected because RangeSum is already doing the accumulation for you and you will Accumulate the accumulated value 
I hope that make sense.
- Mark as New
- Bookmark
- Subscribe
- Mute
- Subscribe to RSS Feed
- Permalink
- Report Inappropriate Content
Thanks. Are there any tutorials about RangeSum and Above that I could look into?
- Mark as New
- Bookmark
- Subscribe
- Mute
- Subscribe to RSS Feed
- Permalink
- Report Inappropriate Content
- « Previous Replies
-
- 1
- 2
- Next Replies »