Unlock a world of possibilities! Login now and discover the exclusive benefits awaiting you.
- Qlik Community
- :
- Forums
- :
- Analytics
- :
- New to Qlik Analytics
- :
- Re: row and column data changed?
- Subscribe to RSS Feed
- Mark Topic as New
- Mark Topic as Read
- Float this Topic for Current User
- Bookmark
- Subscribe
- Mute
- Printer Friendly Page
- Mark as New
- Bookmark
- Subscribe
- Mute
- Subscribe to RSS Feed
- Permalink
- Report Inappropriate Content
row and column data changed?
Please help me,
I need to change the date row data column must be grouped code values for months,
Example:I have this table
| Date | Ítem | Quantity |
|---|---|---|
| 01-ene | 123 | 10 |
| 10-ene | 123 | 15 |
| 15-ene | 100 | 5 |
| 25-ene | 100 | 20 |
| 30-ene | 200 | 10 |
| 02-feb | 123 | 30 |
| 10-feb | 200 | 15 |
| 18-feb | 200 | 10 |
| 24-feb | 200 | 5 |
| 27-feb | 100 | 10 |
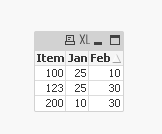
but I need this
| Ítem | Enero | Febrero |
|---|---|---|
| 100 | 25 | 10 |
| 123 | 25 | 30 |
| 200 | 10 | 30 |
Thank you very much
- Mark as New
- Bookmark
- Subscribe
- Mute
- Subscribe to RSS Feed
- Permalink
- Report Inappropriate Content
Try this script:
Table:
LOAD * Inline [
Date, Item, Quantity
01-Jan, 123, 10
10-Jan, 123, 15
15-Jan, 100, 5
25-Jan, 100, 20
30-Jan, 200, 10
02-Feb, 123, 30
10-Feb, 200, 15
18-Feb, 200, 10
24-Feb, 200, 5
27-Feb, 100, 10
];
TempTable:
LOAD Item,
Sum(Quantity) as Jan
Resident Table
Where Month(Date#(Date, 'DD-MMM')) = 'Jan'
Group By Item;
Join (TempTable)
LOAD Item,
Sum(Quantity) as Feb
Resident Table
Where Month(Date#(Date, 'DD-MMM')) = 'Feb'
Group By Item;
DROP Table Table;
Output in a table box object:
- Mark as New
- Bookmark
- Subscribe
- Mute
- Subscribe to RSS Feed
- Permalink
- Report Inappropriate Content
Hi Rodrigo,
if you are using Qlik Sense, please see attached .qvf example.
There is an easier way to do this and it will support all the months you have in your data. I used a single wildmatch expression and a pivot table chart object.
Here is the script: (note I am using this discussion thread as a data source using the web file connector in Qlik Sense)
LOAD [Date],
    [Ítem],
    [Quantity]

FROM [lib://Rodrigo]
(html, codepage is 1252, embedded labels, table is @1);
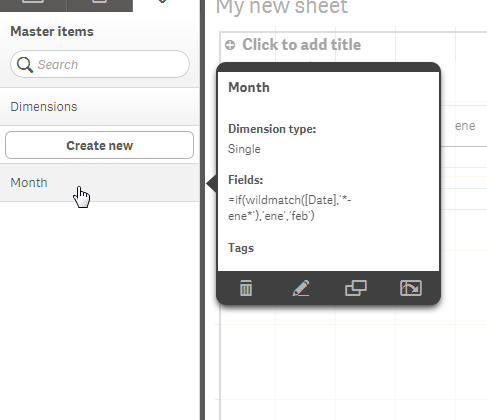
In the master items I used:
if(wildmatch([Date],'*-ene*'),'ene','feb')
The used a Pivot Table object:

Please copy .qvf file to your C:\Users\<user profile>\Documents\Qlik\Sense\Apps and refresh Qlik Sense Desktop with F5
Let us know how you do.
Please mark the appropriate replies as CORRECT / HELPFUL so our team and other members know that your question(s) has been answered to your satisfaction.
Regards,
Mike Tarallo
Qlik
Mike Tarallo
Qlik
- Mark as New
- Bookmark
- Subscribe
- Mute
- Subscribe to RSS Feed
- Permalink
- Report Inappropriate Content
This method will create you the month column from your data without hardcoding the month names.
This assumes your month identifiers are 3 chars in length.
Note you could do this during the data load or as I have done here created a Master dimension I can use later in other charts.

- Mark as New
- Bookmark
- Subscribe
- Mute
- Subscribe to RSS Feed
- Permalink
- Report Inappropriate Content
Thank you very much
But,I have a table in the database and I have this SQL statement, but this bad, that's the idea ,
I do not know how to do it
Please help me)
data:
LOAD *;
SQL
SELECT DATE,ITEM,SUM(QUANTITY) AS "ENE"
FROM PDDTAEPM.DATA
WHERE (DATE BETWEEN 115001 AND 115031) //DATE JULIANA
GROUP BY ITEM;
STORE data INTO datasum.qvd(qvd);
DROP table data;