Unlock a world of possibilities! Login now and discover the exclusive benefits awaiting you.
- Qlik Community
- :
- Forums
- :
- Analytics & AI
- :
- Products & Topics
- :
- Visualization and Usability
- :
- Top 80%
- Subscribe to RSS Feed
- Mark Topic as New
- Mark Topic as Read
- Float this Topic for Current User
- Bookmark
- Subscribe
- Mute
- Printer Friendly Page
- Mark as New
- Bookmark
- Subscribe
- Mute
- Subscribe to RSS Feed
- Permalink
- Report Inappropriate Content
Top 80%
I've found lots of stuff on this for QV (surely it can't be that hard to do one of the most common requirements?!).
What I need is an expression for QlikSense that counts the number of clients making up the top 80% so that I can use the 'limit' option (I think). I have been working with RangeSum() & RangeCount() but as soon as you introduce these into a table the sort reverts to Client ascending. e.g. RangeSum( top(sum(Revenue),1,RowNo()) )
- Mark as New
- Bookmark
- Subscribe
- Mute
- Subscribe to RSS Feed
- Permalink
- Report Inappropriate Content
I don't think this is possible unless your clients are loaded in order of revenue total in the script. The aggr function doesn't have an option to sort the virtual table it creates. And the Limit option in Qlik Sense is rather limited and doesn't have a 'Show only values that accumulate to' like Qlikview has. You'll have to do something like explained in this blog post and manually count the clients: Recipe for a Pareto Analysis
talk is cheap, supply exceeds demand
- Mark as New
- Bookmark
- Subscribe
- Mute
- Subscribe to RSS Feed
- Permalink
- Report Inappropriate Content
Hi Graeme
May be somethink like this below may help you
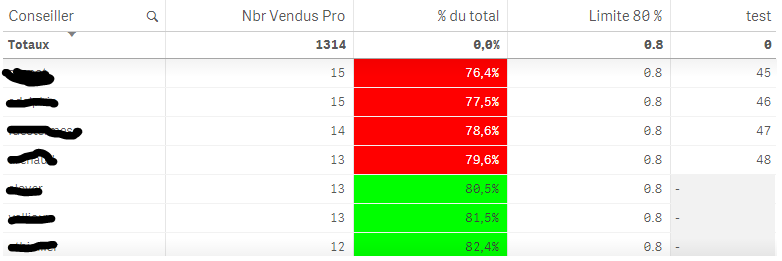
in this table I sum the sales per "conseiller" : (Nbr Vendus PRO)
I calculate the % of the total sales per rep with a range sum above function ( PARETO LIKE)
then I add a "TEST column that count the number in a cumulative mode of "conseiller" that participate with the 80 % of total sales.
So i see that 48 Conseillers are making 80 % of the sales.

to achieve this a add this formula in the test column :
if(
RangeSum(Above(
Count({$<[Resultat Rapport Rdv]={'Vendu'}>}[Resultat Rapport Rdv]),0,RowNo()))
/
Count(TOTAL{$<[Resultat Rapport Rdv]={'Vendu'}>}[Resultat Rapport Rdv])<=0.8,
Rangesum(above(count(distinct(Conseiller)),0,rowno()),null()
))
Hope it's help
Bruno
- Mark as New
- Bookmark
- Subscribe
- Mute
- Subscribe to RSS Feed
- Permalink
- Report Inappropriate Content
Hi,
Maybe Try expression:
If(RangeSum(Above(Sum(Sales),0,RowNo()))/Sum(TOTAL Sales) <= 0.8,Sum(Sales))
- Mark as New
- Bookmark
- Subscribe
- Mute
- Subscribe to RSS Feed
- Permalink
- Report Inappropriate Content
Thx Bruno.
I'm able to identify the required data with Rangesum(Above... and use an offset of 1 to include the full 80% -

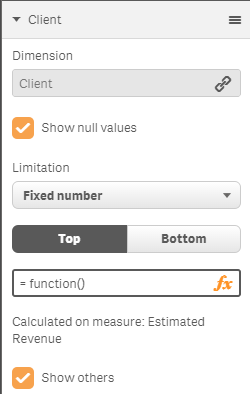
Where it falls down is trying to implement this for a Qlik Sense pie chart. I planned on working out the correct number of clients and then use the 'Fixed number' option -

But I can't get it to return any results (i.e. a single value)
Regards.
p.s. I'm astounded this is not an option, perhaps someone from Qlik could shed some light!
- Mark as New
- Bookmark
- Subscribe
- Mute
- Subscribe to RSS Feed
- Permalink
- Report Inappropriate Content
Hi
Not sure to be able to help you more. Too newbee in QlikSense.
Nethertheless, if you want in your pie chart only the client reaching your 80%'s goal , I think you must use a calculated dimension ( Only the Client that make 80% of sales)
I don't know how to achieve that, Sorry
May be a Aggr fonction with a range sum above fonction to sort only the usefull client?
Bruno