Unlock a world of possibilities! Login now and discover the exclusive benefits awaiting you.
- Qlik Community
- :
- Forums
- :
- Analytics
- :
- New to Qlik Analytics
- :
- Re: Capture Image of Mashup in Web Application
- Subscribe to RSS Feed
- Mark Topic as New
- Mark Topic as Read
- Float this Topic for Current User
- Bookmark
- Subscribe
- Mute
- Printer Friendly Page
- Mark as New
- Bookmark
- Subscribe
- Mute
- Subscribe to RSS Feed
- Permalink
- Report Inappropriate Content
Capture Image of Mashup in Web Application
Hi All,
I currently use version 2.1 of qliksense both desktop and server version. I however want to be able to capture graphs rendered in my webpage. Qliksense mashup does not allow a "save as" image option in the web page, so I would like suggestions on how to go about this. My idea is to click on a button that captures this graph as an image and download to user's desktop. I have tried to use html2canvas but it does not work.
- Tags:
- mashup api
- web mashup
- « Previous Replies
-
- 1
- 2
- Next Replies »
- Mark as New
- Bookmark
- Subscribe
- Mute
- Subscribe to RSS Feed
- Permalink
- Report Inappropriate Content
The id, btw, is the html id of the element, not the id of the chart. Sorry if that wasn't clear.
- Mark as New
- Bookmark
- Subscribe
- Mute
- Subscribe to RSS Feed
- Permalink
- Report Inappropriate Content
Thanks for the reply. I have tried the path before and also tried again, but it doesn't load the script, it still comes up with script error. Also for the html id, yes it is the html id I am using and it gives that same error.
- Mark as New
- Bookmark
- Subscribe
- Mute
- Subscribe to RSS Feed
- Permalink
- Report Inappropriate Content
The script not loading in is a path issue, and without having the entire project in an identical environment as you, I cannot say for certain what the correct path for your specific project should be, I'm sorry. You can continue to test with the url i provided.
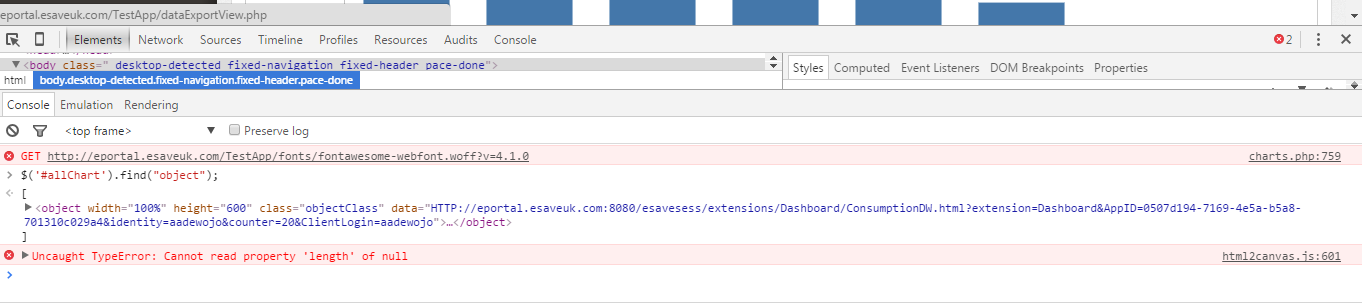
The error you are getting, cannot read property length of null, is almost certainly related to the function not being able to find an element with the specified id. You could check in console with the id you're providing to the function, to see if you can find the element, or try another element.
- Mark as New
- Bookmark
- Subscribe
- Mute
- Subscribe to RSS Feed
- Permalink
- Report Inappropriate Content
Hi,
Thanks for the reply. I have tried everything you suggested. It still complains of it being null. I used console to find the id, and it was able to find the id and its content. So I wonder why qBlob can not find it. I have a attached a screenshot of this to this email.
Thanks.
- Mark as New
- Bookmark
- Subscribe
- Mute
- Subscribe to RSS Feed
- Permalink
- Report Inappropriate Content
Any luck on doing this?
- Mark as New
- Bookmark
- Subscribe
- Mute
- Subscribe to RSS Feed
- Permalink
- Report Inappropriate Content
None yet. Do you have a suggestion for me?
- « Previous Replies
-
- 1
- 2
- Next Replies »