Unlock a world of possibilities! Login now and discover the exclusive benefits awaiting you.
- Qlik Community
- :
- Forums
- :
- Analytics & AI
- :
- Products & Topics
- :
- App Development
- :
- 100% Stacked bar chart issue (stack showing anythi...
- Subscribe to RSS Feed
- Mark Topic as New
- Mark Topic as Read
- Float this Topic for Current User
- Bookmark
- Subscribe
- Mute
- Printer Friendly Page
- Mark as New
- Bookmark
- Subscribe
- Mute
- Subscribe to RSS Feed
- Permalink
- Report Inappropriate Content
100% Stacked bar chart issue (stack showing anything but 100% )
Hi All
I have been trying to create a 100% stacked bar chart with the below scenario:
We are trying to determine the % of each Main Reason for people leaving (6 possible response categories) / sum of all main reasons. We have used 2 group dimensions:
1. Includes: age, band, gender...
2. Includes: Main reason and sub reason
Each leaver can select multiple reasons for leaving.
We have tried the following measure:
Measure 1= Sum(distinct {<Period=, DateNum = {">=$(=$(v_CM_Start))<=$(=$(v_MaxDate))"}, DataType = {'Leavers'}>} Leavers_Count)
Measure 2=count(distinct {<Period=, DateNum = {">=$(=$(v_CM_Start))<=$(=$(v_MaxDate))"}, DataType = {'Leavers'}>} EmployeeID)
Measure 3 =Sum(distinct {<Period=, DateNum = {">=$(=$(v_CM_Start))<=$(=$(v_MaxDate))"}, DataType = {'Leavers'}>} EmployeeID)
Measure 4= Sum( {<Period=, DateNum = {">=$(=$(v_CM_Start))<=$(=$(v_MaxDate))"}, DataType = {'Leavers'}>} Leavers_Count)
/Sum( Total <[Main Reason]> {<Period=, DateNum = {">=$(=$(v_CM_Start))<=$(=$(v_MaxDate))"}, DataType = {'Leavers'}>} Leavers_Count)
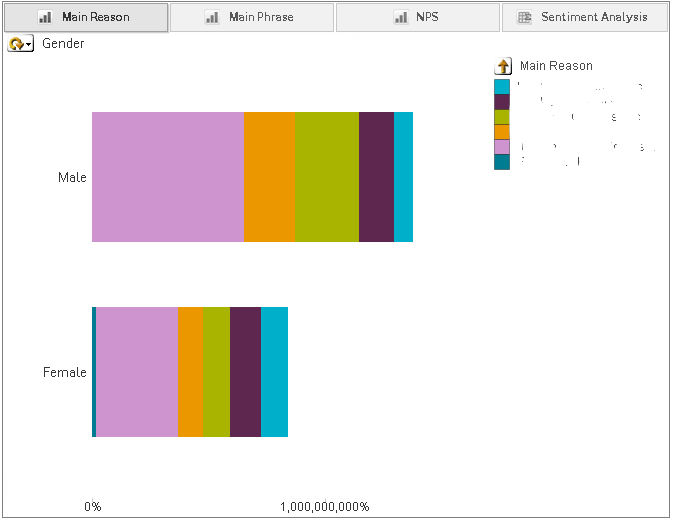
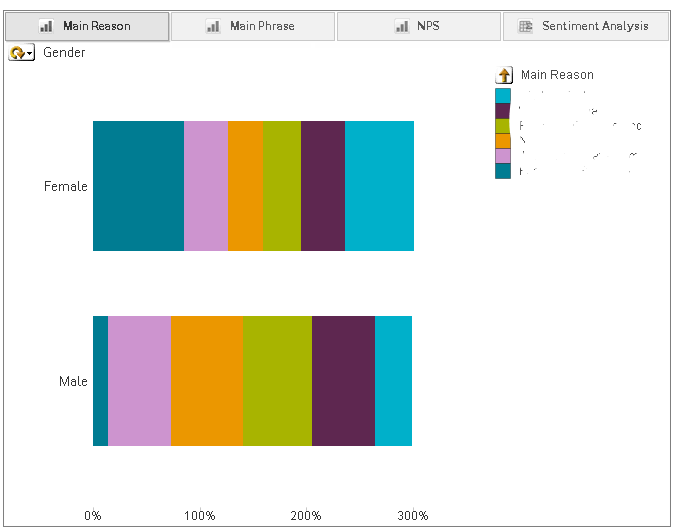
I have attached screenshots of the graph for each of the 4 measures (measure 1 and 2 show the same). Unfortunately, I am not able to attached the app or a sample app due to security reasons.
The results of the 4th measure makes the most sense but it adds up to 300%.
Any suggestions or tips?
Thanks!
- Tags:
- bar chart
- Mark as New
- Bookmark
- Subscribe
- Mute
- Subscribe to RSS Feed
- Permalink
- Report Inappropriate Content
Measure 4 is close enough. 😃
Your chart have 2 dimensions, but 100% u need by each.
Try Count( [reason] ) / Count( TOTAL <gender> [reason] )
It will return Count( [reason] ) for each reason type (six of them) and gender. And Total will return total values for each gender.
- Mark as New
- Bookmark
- Subscribe
- Mute
- Subscribe to RSS Feed
- Permalink
- Report Inappropriate Content
This kind of works whereby it gave me 100%, the issue now is that for each main reason we can have several sub reasons so we need to be able to count(distinct(EmployeeID)) somewhere because if 1 main reason has multiple sub-reasons, the % shown will not be accurate and the only way to deduplicate is if we count it based on EmployeeID.
How do you recommend we introduce that to the following expression:
Count( {<Period=, DateNum = {">=$(=$(v_CM_Start))<=$(=$(v_MaxDate))"}, DataType = {'Leavers'}, [Exit Interview Eligible]={'True'}>} [Main Reason] ) /
Count( TOTAL <Gender, [Global Band (E)],Tenure, [Age Grouping], Country, [Company Code],Discover,Columbus,Nationality> {<Period=, DateNum = {">=$(=$(v_CM_Start))<=$(=$(v_MaxDate))"}, DataType = {'Leavers'}, [Exit Interview Eligible]={'True'}>}[Main Reason] )
?
Thanks!
- Mark as New
- Bookmark
- Subscribe
- Mute
- Subscribe to RSS Feed
- Permalink
- Report Inappropriate Content
I tried the following expression but the distinct part is bringing the stacked bar to where it doesn't show 100% anymore... when distinct is removed, the stack goes back to 100% and the numbers are pretty close to what they should be but not exact..
Count(DISTINCT {<Period=, DateNum = {">=$(=$(v_CM_Start))<=$(=$(v_MaxDate))"}, DataType = {'Leavers'}, [Exit Interview Eligible]={'True'}>} [EmployeeID] ) /
Count ( distinct TOTAL <Gender, [Global Band (E)],Tenure, [Age Grouping], Country, [Company Code],Discover,Columbus,Nationality> {<Period=, DateNum = {">=$(=$(v_CM_Start))<=$(=$(v_MaxDate))"}, DataType = {'Leavers'}, [Exit Interview Eligible]={'True'}>} [EmployeeID] )