Unlock a world of possibilities! Login now and discover the exclusive benefits awaiting you.

- Qlik Community
- :
- Forums
- :
- Analytics & AI
- :
- Products & Topics
- :
- App Development
- :
- Average and calculated dimensions
- Subscribe to RSS Feed
- Mark Topic as New
- Mark Topic as Read
- Float this Topic for Current User
- Bookmark
- Subscribe
- Mute
- Printer Friendly Page

 ManuelRühl
- Mark as New
- Bookmark
- Subscribe
- Mute
- Subscribe to RSS Feed
- Permalink
- Report Inappropriate Content
Average and calculated dimensions
Hey,
I want to show the Average Stock Quantity of the Top 5 suppliers.
Top 5 means the 5 suppliers with the highest Average Stock Quantity.
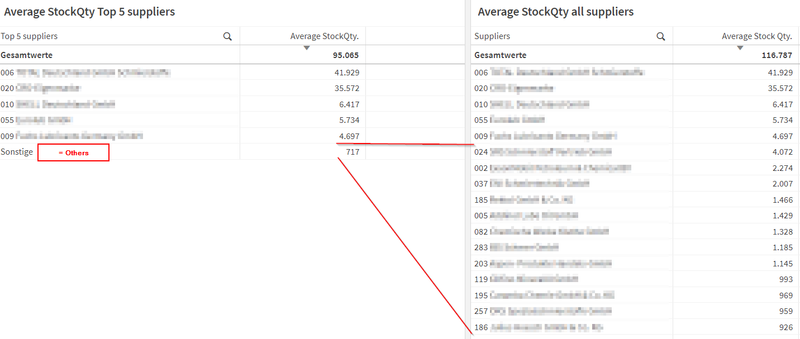
The calculated dimension works as expected. I get the 5 suppliers with the highest average Stock Quantity.

This expression works fine for the non-calculated dimension on the right side:

But on the left side, the value of "Sonstige" (others) is not correct.
Where is my mistake? 🤔
Accepted Solutions
 Rohan
Rohan
- Mark as New
- Bookmark
- Subscribe
- Mute
- Subscribe to RSS Feed
- Permalink
- Report Inappropriate Content
Hi @ManuelRühl ,
Try this once :
=if(dimensionality()=0,
avg(aggr(sum({<%DATEKEY_BESTAND={">=$(=addmonths(vToday,-12))"}>}Bestandsmenge)),%DATEKEY_BESTAND)),
avg(aggr(sum({<%DATEKEY_BESTAND={">=$(=addmonths(vToday,-12))"}>}Bestandsmenge)),%DATEKEY_BESTAND,HauptLieferant))/
Count({<%DATEKEY_BESTAND={">=$(=addmonths(vToday,-12))"}>} Distinct HauptLieferant))
I believe this should do the trick. Let me know if it works for you.
Regards,
Rohan.
Rohan
- Mark as New
- Bookmark
- Subscribe
- Mute
- Subscribe to RSS Feed
- Permalink
- Report Inappropriate Content
Hi @ManuelRühl ,
Try this once :
=if(dimensionality()=0,
avg(aggr(sum({<%DATEKEY_BESTAND={">=$(=addmonths(vToday,-12))"}>}Bestandsmenge)),%DATEKEY_BESTAND)),
avg(aggr(sum({<%DATEKEY_BESTAND={">=$(=addmonths(vToday,-12))"}>}Bestandsmenge)),%DATEKEY_BESTAND,HauptLieferant))/
Count({<%DATEKEY_BESTAND={">=$(=addmonths(vToday,-12))"}>} Distinct HauptLieferant))
I believe this should do the trick. Let me know if it works for you.
Regards,
Rohan.
ManuelRühl
- Mark as New
- Bookmark
- Subscribe
- Mute
- Subscribe to RSS Feed
- Permalink
- Report Inappropriate Content
Thanks a lot, it worked nearly perfect.
Calculating the average not by using the avg()-function did the trick.
I just had to do some small modifications:
An when I divide by the amount of relevant months, I have to sum up the inventory, not calculting the average.
