Unlock a world of possibilities! Login now and discover the exclusive benefits awaiting you.
- Qlik Community
- :
- Forums
- :
- Analytics & AI
- :
- Products & Topics
- :
- App Development
- :
- Client with third largest sales
- Subscribe to RSS Feed
- Mark Topic as New
- Mark Topic as Read
- Float this Topic for Current User
- Bookmark
- Subscribe
- Mute
- Printer Friendly Page
- Mark as New
- Bookmark
- Subscribe
- Mute
- Subscribe to RSS Feed
- Permalink
- Report Inappropriate Content
Client with third largest sales
Hi,
I'm trying to create a KPI for each one of the top3 clients by margin. I've so far managed to create a bar chart with the clients with the top 3 margins. But the (slightly) same code won't work for a KPI.
Here's the (working) code for the measure in the bar chart:
if(rank((sum(Valor) - sum([Custo]*Horas))/sum(Valor))<=3,(sum(Valor) - sum([Custo]*Horas))/sum(Valor))
And here's the one I've been trying to make work on a KPI:
if(rank((sum(Valor) - sum([Custo]*Horas))/sum(Valor))=3,(sum(Valor) - sum([Custo]*Horas))/sum(Valor))
The problem is the KPI is always "-" no matter what value or expression I put in the code above. I assume there's a misunderstanding in how the aggr function works on my part, but couldn't tell where the error is coming from. Can someone help me?
Thanks in advance.
- Tags:
- aggr help
- kpi object
Accepted Solutions
- Mark as New
- Bookmark
- Subscribe
- Mute
- Subscribe to RSS Feed
- Permalink
- Report Inappropriate Content
Can you try this:
Max(Aggr((Sum(Valor) - Sum([Custo]*Horas))/Sum(Valor), Client), 3)
and may be this to get the name of the 3rd larget client
FirstSortedValue(Client, -Aggr((Sum(Valor) - Sum([Custo]*Horas))/Sum(Valor), Client), 3)
- Mark as New
- Bookmark
- Subscribe
- Mute
- Subscribe to RSS Feed
- Permalink
- Report Inappropriate Content
I can't spot the aggr() function in your code, have you posted the correct code snippet?
- Mark as New
- Bookmark
- Subscribe
- Mute
- Subscribe to RSS Feed
- Permalink
- Report Inappropriate Content
Try maybe
Sum( Aggr(
if(rank((sum(Valor) - sum([Custo]*Horas))/sum(Valor))<=3,(sum(Valor) - sum([Custo]*Horas))/sum(Valor))
, ClientField
))
- Mark as New
- Bookmark
- Subscribe
- Mute
- Subscribe to RSS Feed
- Permalink
- Report Inappropriate Content
Can you try this:
Max(Aggr((Sum(Valor) - Sum([Custo]*Horas))/Sum(Valor), Client), 3)
and may be this to get the name of the 3rd larget client
FirstSortedValue(Client, -Aggr((Sum(Valor) - Sum([Custo]*Horas))/Sum(Valor), Client), 3)
- Mark as New
- Bookmark
- Subscribe
- Mute
- Subscribe to RSS Feed
- Permalink
- Report Inappropriate Content
Oh, I'm sorry. I was testing two or three formulas and ended up posting the wrong ones.
- Mark as New
- Bookmark
- Subscribe
- Mute
- Subscribe to RSS Feed
- Permalink
- Report Inappropriate Content
Both formulas worked fine. Thank you a lot! I didn't knew I could pass another parameter to the max function. Can you please explain the use of a minus sign in the aggr function? From what I've tested, removing the sign inverts the "temporary table" create by the aggr function. Is this correct?
- Mark as New
- Bookmark
- Subscribe
- Mute
- Subscribe to RSS Feed
- Permalink
- Report Inappropriate Content
Yes, you are right. negative sign in front of Aggr() sort the table in descending order picking the third largest client. If you remove the negative sign, the FirstSortedValue will pick the 3rd smallest client
- Mark as New
- Bookmark
- Subscribe
- Mute
- Subscribe to RSS Feed
- Permalink
- Report Inappropriate Content
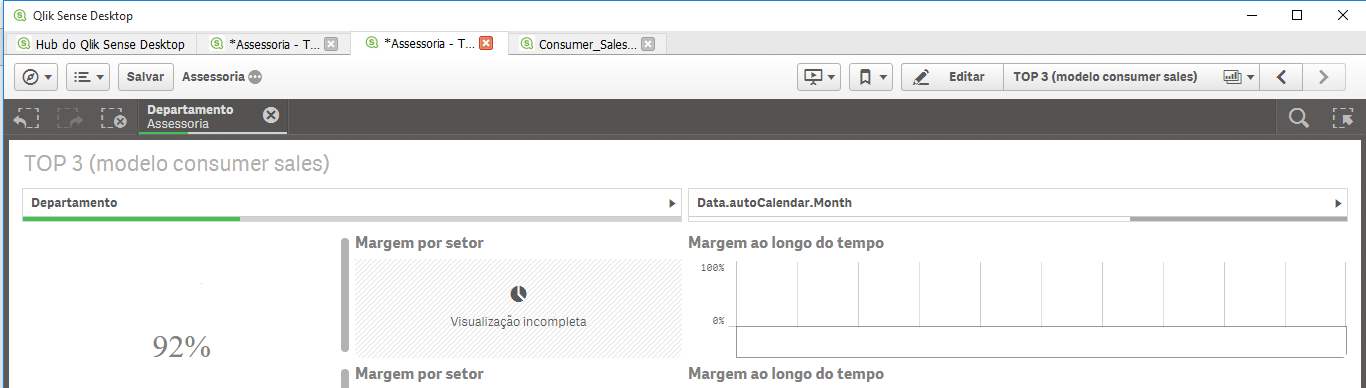
I'm also trying to compare this margin over time using an line chart, but the value simply doesn't displays. From what I understand including the "Date.month" in dimensions and this expression in measure would accomplish that, but it's not working.
For testing I've set up a filter based up on month and a KPI displaying the third largest margin. It changes as I filter the months, so it's working alright. But the graphic besides the kpi is always blank.
- Mark as New
- Bookmark
- Subscribe
- Mute
- Subscribe to RSS Feed
- Permalink
- Report Inappropriate Content
Have you added your time dimension field used in the charts also to the Aggr() function dimension list?
- Mark as New
- Bookmark
- Subscribe
- Mute
- Subscribe to RSS Feed
- Permalink
- Report Inappropriate Content
Now I have and it worked fine. Thanks! I'm really impressed by such a colaborative community 