Unlock a world of possibilities! Login now and discover the exclusive benefits awaiting you.

- Qlik Community
- :
- Forums
- :
- Analytics & AI
- :
- Products & Topics
- :
- App Development
- :
- Colors greyed out after selection
- Subscribe to RSS Feed
- Mark Topic as New
- Mark Topic as Read
- Float this Topic for Current User
- Bookmark
- Subscribe
- Mute
- Printer Friendly Page

 deniscamh
- Mark as New
- Bookmark
- Subscribe
- Mute
- Subscribe to RSS Feed
- Permalink
- Report Inappropriate Content
Colors greyed out after selection
Hi all,
I created a bar chart with the years and categories as dimensions:
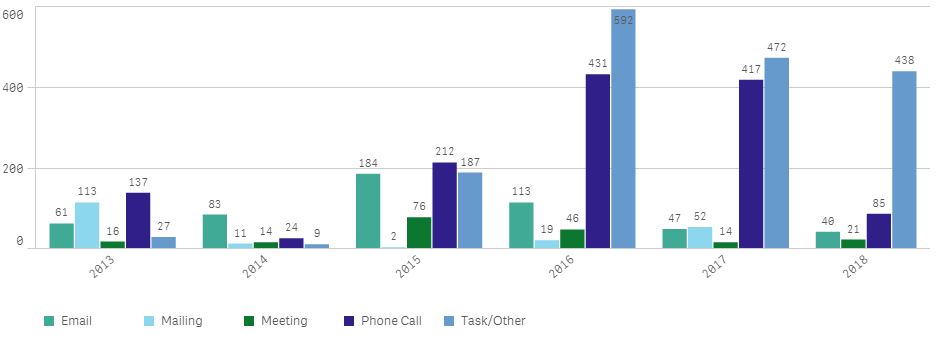
My expression is: count({<Total_Period = {'Past Actions'},Year = {">= $(=Year(AddYears(Max([Action Date]),-5)))"}>} distinct [Action Import ID])
When I make a Year selection the colors for not selected years become grey but the data still showing:
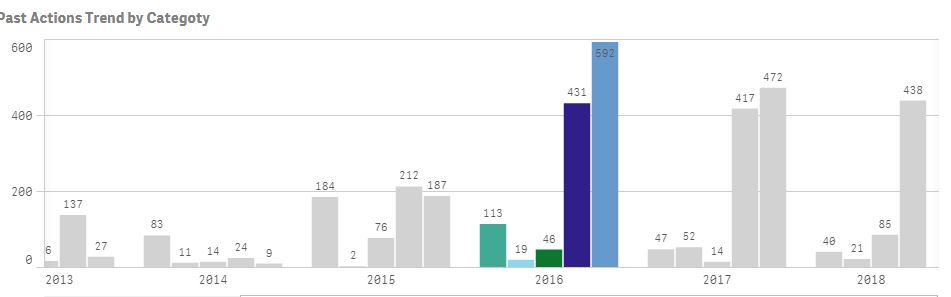
What should I do to prevent colors become grey?
Thank
 CarlosAMonroy
- Mark as New
- Bookmark
- Subscribe
- Mute
- Subscribe to RSS Feed
- Permalink
- Report Inappropriate Content
Hi Denis,
Maybe just add the year to the set analysis as a exclude selection field. Something like:
count({<Year=, Total_Period = {'Past Actions'},Year = {">= $(=Year(AddYears(Max([Action Date]),-5)))"}>} distinct [Action Import ID])
Hope that helps,
Carlos M
deniscamh
- Mark as New
- Bookmark
- Subscribe
- Mute
- Subscribe to RSS Feed
- Permalink
- Report Inappropriate Content
Thanks Carlos,
I already tried it.
Does not work, same result.
Thanks

 d44973694
- Mark as New
- Bookmark
- Subscribe
- Mute
- Subscribe to RSS Feed
- Permalink
- Report Inappropriate Content
Did you find a solution to this?
