Unlock a world of possibilities! Login now and discover the exclusive benefits awaiting you.
- Qlik Community
- :
- Forums
- :
- Analytics & AI
- :
- Products & Topics
- :
- App Development
- :
- Re: Count distinct per day - new datamodel
- Subscribe to RSS Feed
- Mark Topic as New
- Mark Topic as Read
- Float this Topic for Current User
- Bookmark
- Subscribe
- Mute
- Printer Friendly Page
- Mark as New
- Bookmark
- Subscribe
- Mute
- Subscribe to RSS Feed
- Permalink
- Report Inappropriate Content
Count distinct per day - new datamodel
Hi everyone
Right now I am working on a project where we use a "canonical date bridge" as a FACT table. This entails creating new rows for all tasks everyday, so we daily can count how many there are and what status they are in (when it changes). Of course this means that we get a giant FACT table, because for all 2,4 million different tasks, we create a new row every day with the new date.
I have recently been playing around with creating a new data model, where we just use a FACT table that has keys to the task dimension. in the dimension every task just has a "valid_from" and "valid_to" column, which of course drastically lowers the row count. This is amazing, but the problem is, that there is one vizualisation in the front end I can't make work.
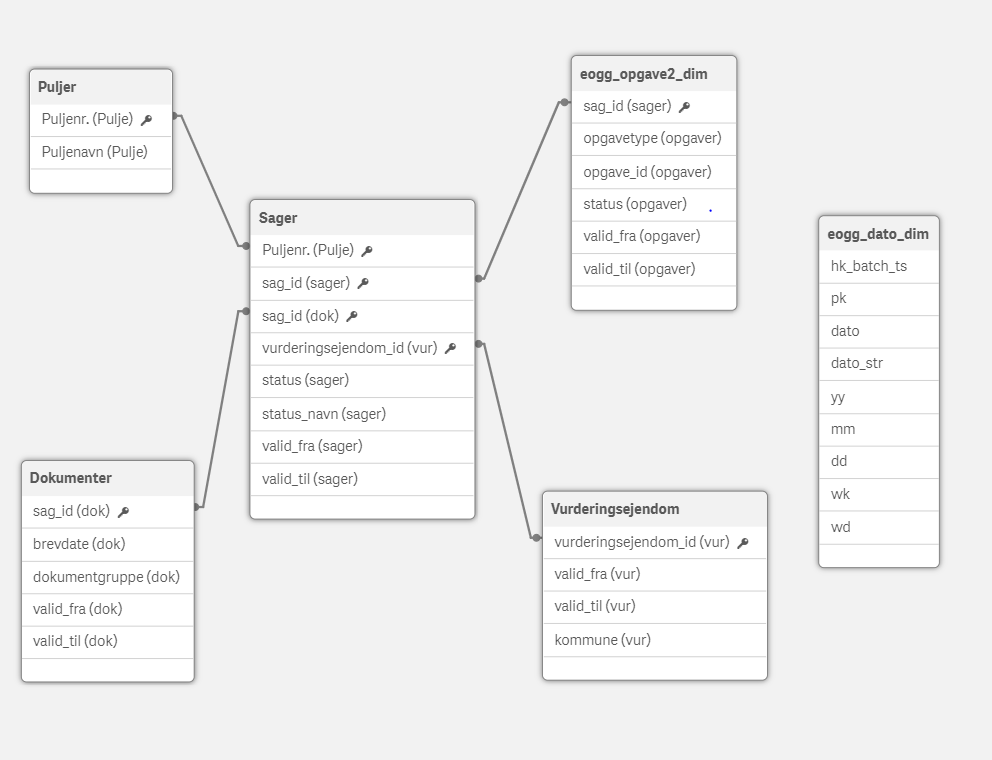
If you look at the attached screenshot ("Datamodel"), you can see that I have a datamodel with a FACT table and dimensions and then a Calendar not associated with the datamodel.
What I want to visualize, is a stacked bar-chart like the one in the attached screenshot ("Sagsbunke"). Where it counts how many tasks there are every day stacked by their status. Now that I dont have a row per day, I have tried to make a set expression where the fields "Valid_from" and "Valid_to" evaluate on the date from the un-associated calendar:
count({<yy=, mm=, dd=, [valid_from (sager)] = {"<=[dato]"}, [valid_to (sager)] = {">=[date]"}>} Distinct [sag_id (sager)])
But I can't make a field relate to another field in a set expression? It just wont work. I was hoping "Valid_from" and "Valid_to" could evaluate on the Date field, and then just use date on the x-axis of the bar chart, so I would count the number of tasks valid per day.
Can anyone help me with what to do here?
Thanks in advance 🙂
Best,
Peter
- Mark as New
- Bookmark
- Subscribe
- Mute
- Subscribe to RSS Feed
- Permalink
- Report Inappropriate Content
Conceptually this should work (not sure how it will perform) but your syntax is incorrect. "<=" is a Search operator, so it expects to be followed by a piece of text to search for. So you will have to use the field value, not the field name, like this:
[valid_from (sager)] = {"<=$(=[dato])"}
That works only if you have one dato value possible, so I usually include a function like max() to ensure one value:
[valid_from (sager)] = {"<=$(=Max([dato]))"}
-Rob
http://www.easyqlik.com
http://masterssummit.com
http://qlikviewcookbook.com
- Mark as New
- Bookmark
- Subscribe
- Mute
- Subscribe to RSS Feed
- Permalink
- Report Inappropriate Content
Hi Rob
Thanks a lot for you answer. That makes a lot of sense. However, if I use max() won't it only evaluate on one day only? I want it to be able to count the specific tasks on every specific dato/date (the X-axis). Will this also be able to solve this if I use max()?
Best,
Peter
- Mark as New
- Bookmark
- Subscribe
- Mute
- Subscribe to RSS Feed
- Permalink
- Report Inappropriate Content
I don't think you can use a set analysis approach for this, as set analysis cannot use the row dimension value. Instead you would need to use an if which I think would perform very poorly.
using the original fact table approach, do you really need to create a fact row for every task * day. Don't you just need to create a link table of dates? Admittedly this link table could still be quite large depending on how many dates you have.
-Rob
- Mark as New
- Bookmark
- Subscribe
- Mute
- Subscribe to RSS Feed
- Permalink
- Report Inappropriate Content
But since I only have a "valid_from" and "valid_to" field in my task-dimension, then I won't be able to count the number of tasks on the dates in between with just a link table of dates?
If you look at the attached sceen shot. Let's say that I have a task that has "valid_from" 18/01/2022 and "valid_to" 24/01/2022. Then if I use the link table, will I still be able to count that task on the 20/01/2022? The task has no date = 20/01/2022, but it is still "active" on that date because it's between "valid_from" and "valid_to". So I want to count on the 20/01/2022.
I hope that makes sense?
- Mark as New
- Bookmark
- Subscribe
- Mute
- Subscribe to RSS Feed
- Permalink
- Report Inappropriate Content
I'm thinking of a link table like this.
Calendar:
Load
*,
Year(Date) as Year,
Month(Date) as Month
;
LOAD
Date(Today(2)-RecNo()) as Date
AutoGenerate 100
;
Tasks:
Load
RecNo() as TaskId,
1 as TaskCounter,
Date(Today(2) - ceil(Rand()*20)) as ValidFrom,
Date(Today(2) + ceil(Rand()*50)) as ValidTo
AutoGenerate 5000
;
DateLink:
LOAD TaskId,
Date(ValidFrom + IterNo()-1) as Date
Resident Tasks
While ValidFrom + IterNo()-1 <= ValidTo
;

Then your barchart is;
Dim: Date
Measure: Sum(TaskCounter)
It may be that the link table would get too big to perform well, but i may be worth a try.
-Rob
http://www.easyqlik.com
http://masterssummit.com
http://qlikviewcookbook.com
- Mark as New
- Bookmark
- Subscribe
- Mute
- Subscribe to RSS Feed
- Permalink
- Report Inappropriate Content
Ahh yes. But this will create a row for each day between "valid_from" and "valid_to" for each TaskId right?
Thas is the same as the solution I have now, but the table just get's extremely big. It works, but it is just very big. But I guess that is the solution I will have to keep using.
Thanks for the help though:)
/Peter
- Mark as New
- Bookmark
- Subscribe
- Mute
- Subscribe to RSS Feed
- Permalink
- Report Inappropriate Content
From your original post, it sounded like you were creating additional fact rows. I was suggesting creating the additional rows in a link table, which although would have many rows would be small amount of data. That is especially true if you can autonumber the keys.
-Rob