Unlock a world of possibilities! Login now and discover the exclusive benefits awaiting you.
- Qlik Community
- :
- Forums
- :
- Analytics & AI
- :
- Products & Topics
- :
- App Development
- :
- Customizing / Fixing Chart Bar Colors
- Subscribe to RSS Feed
- Mark Topic as New
- Mark Topic as Read
- Float this Topic for Current User
- Bookmark
- Subscribe
- Mute
- Printer Friendly Page
- Mark as New
- Bookmark
- Subscribe
- Mute
- Subscribe to RSS Feed
- Permalink
- Report Inappropriate Content
Customizing / Fixing Chart Bar Colors
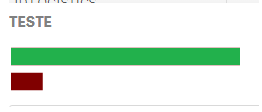
Hello! I created a master item (Dimension), where I classify if an activity is (on time) or (out of date). I would like to represent this in a chart, but I would like to choose the green color for the activities that are (within the time limit) and (red) for the activities (out of date).
I tried to do this by expression, but I could not do that in QlikSense
Can anyone give me tips on how to solve?
Ex: Master Item (Dimension):
=If(Floor(Aggr(Num((Today() - Max(data_ocorrida))/30),cod_conta)) <= 3,'1 - RELAC. EM DIA','2 - NECES. RELAC.')
Ex: Appearance> Presentation> Colors and Caption (By Expression):
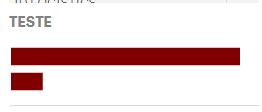
I tried to do this in the expression but the two bars are red.
It did not work out as I would have liked.
If(Floor(Aggr(Num((Today() - Max(data_ocorrida))/30),cod_conta)) <= 3,Green(), Red())
Current results:
Expected outcome:
I'm a beginner and thank you for the attention and help from everyone.
Thank you!
Hugs
- Mark as New
- Bookmark
- Subscribe
- Mute
- Subscribe to RSS Feed
- Permalink
- Report Inappropriate Content
- Mark as New
- Bookmark
- Subscribe
- Mute
- Subscribe to RSS Feed
- Permalink
- Report Inappropriate Content
Hi,
Interesting. I was going to reply that your formulas should work, but then I tried it myself and it seems to work only for when it's a specific value eg xxxx = something 3 not for when xxxx <= 3. Not sure if it has to do with the AGGR or not
For example, try all that that you're doing but use =1 instead of <=3 in both formulas. Not that this is what you want but I'm just trying to confirm if it makes a difference. Please let me know the results with you try with a specific value
I checked the post Vladimir recommended and it works fine but in that example there is no range or aggregate as you have here
Cheers,
Luis