Unlock a world of possibilities! Login now and discover the exclusive benefits awaiting you.

- Qlik Community
- :
- Forums
- :
- Analytics & AI
- :
- Products & Topics
- :
- App Development
- :
- Discrepancy of Line Graphs
- Subscribe to RSS Feed
- Mark Topic as New
- Mark Topic as Read
- Float this Topic for Current User
- Bookmark
- Subscribe
- Mute
- Printer Friendly Page

 Josh
Josh
- Mark as New
- Bookmark
- Subscribe
- Mute
- Subscribe to RSS Feed
- Permalink
- Report Inappropriate Content
Discrepancy of Line Graphs
Hello!
We have not been able to figure this out at my workplace, so I am bringing it up to the community.
Scenario: I am trying to provide visuals for our customers who view our web page and then interact(engage) with our webpage.
Graph 1: a line graph showing two lines over time.
Line one: Count of unique Page Views
Line two: Count of unique Engagement with the webpage (hitting a play button, interacting with media...etc)
Graph 2: a line graph showing the ratio of engagement to page views. (Number of unique engagements divided by unique page views).
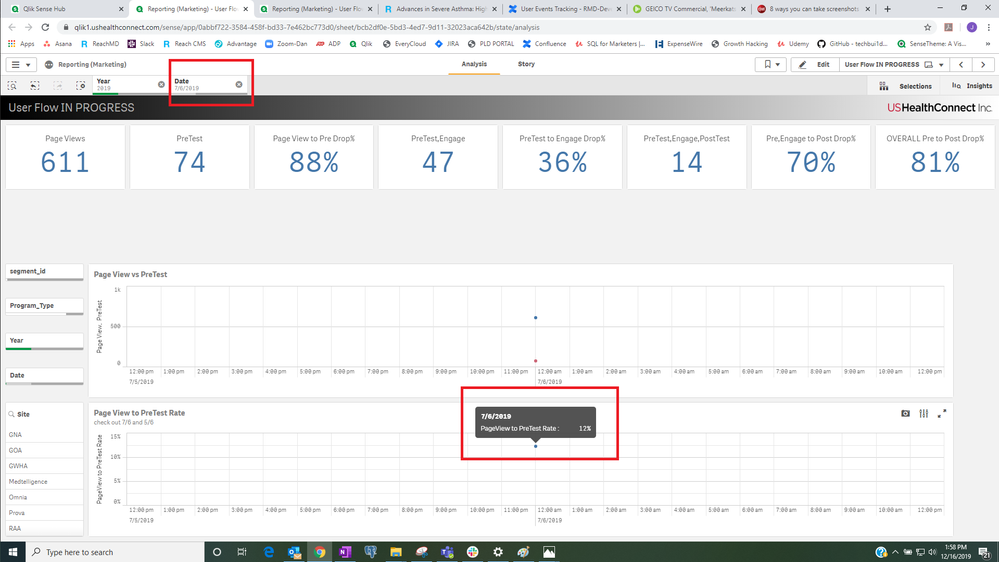
The crazy part is that when I hover over both these graphs....The ratio does not = the correct answer when the "exact date" is not selected. See attached images for better description. 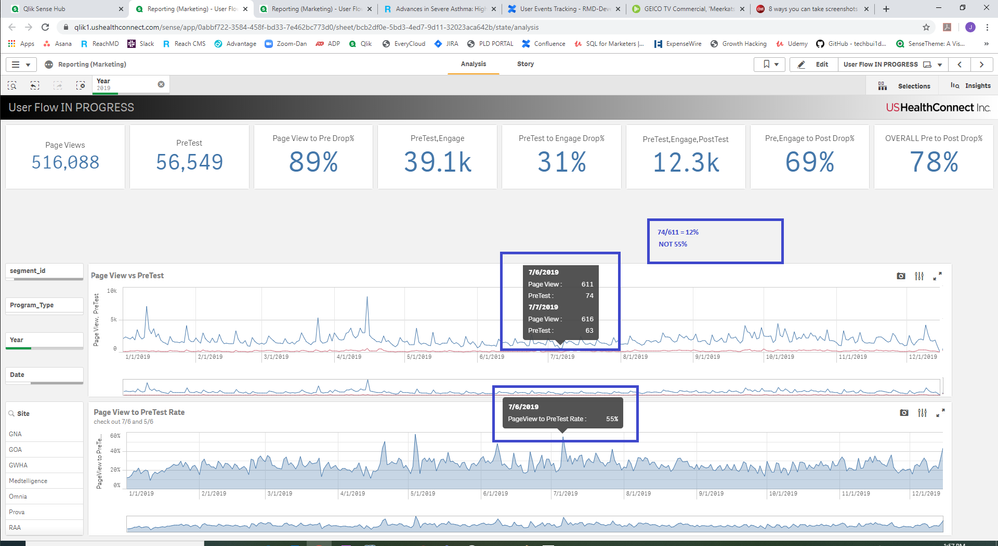
- Tags:
- line chart

 dwforest
- Mark as New
- Bookmark
- Subscribe
- Mute
- Subscribe to RSS Feed
- Permalink
- Report Inappropriate Content
If you are using continuous scale your ratios are averaging in the roll-up and your measure is not using an Aggr() to calculate by the date
Don't use a continuous scale or use an Aggr()
