Unlock a world of possibilities! Login now and discover the exclusive benefits awaiting you.
- Qlik Community
- :
- Forums
- :
- Analytics & AI
- :
- Products & Topics
- :
- App Development
- :
- Displaying Raw Data for Export in QlikSense
- Subscribe to RSS Feed
- Mark Topic as New
- Mark Topic as Read
- Float this Topic for Current User
- Bookmark
- Subscribe
- Mute
- Printer Friendly Page
- Mark as New
- Bookmark
- Subscribe
- Mute
- Subscribe to RSS Feed
- Permalink
- Report Inappropriate Content
Displaying Raw Data for Export in QlikSense
Hey everyone.
I have a business user who we want to automate a report for. He typically puts in a request for a raw data file in excel that he then pivots and does a number of things to. We're working with him to recreate a lot in Qlik, but the nature of the report is such that a raw pull of about a years worth of data is run overnight, and then when the report is opened, he can select how he wants to slice and dice it to see the data. It's a large raw data set, but that's because there are a lot of possible options to slice by.
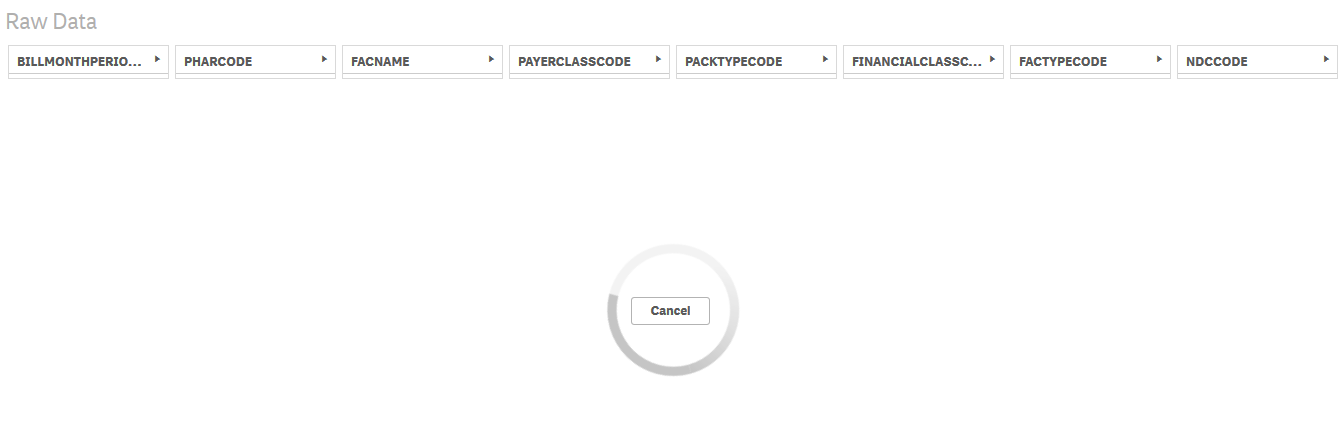
My question is this...how can I give him the option to export data (after he slices) to excel without the system just bogging down from trying to show the raw, pre filtered data? Right now the raw data page I created just tries to load everything before you can even apply a filter (see image below) and doesn't finish. I want no data to show until he selects what he wants from the drop downs above, so he can then export to excel. Maybe a filter exists, you press a button, and it displays? Does anyone know if that is possible or something similar?
Accepted Solutions
- Mark as New
- Bookmark
- Subscribe
- Mute
- Subscribe to RSS Feed
- Permalink
- Report Inappropriate Content
You can add a calculation condition to a chart.
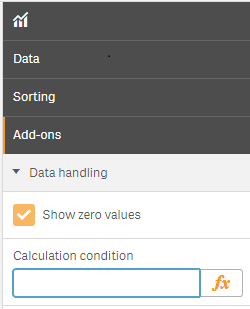
That allows you to prevent the chart from rendering until some selections have been made. Perhaps an expression like =sum(aggr(1, DimA, DimB, DimC, ..., DimN)) < 50000. Replace DimA, DimB, DimC, ..., DimN with the dimensions of the chart.
talk is cheap, supply exceeds demand
- Mark as New
- Bookmark
- Subscribe
- Mute
- Subscribe to RSS Feed
- Permalink
- Report Inappropriate Content
You can add a calculation condition to a chart.
That allows you to prevent the chart from rendering until some selections have been made. Perhaps an expression like =sum(aggr(1, DimA, DimB, DimC, ..., DimN)) < 50000. Replace DimA, DimB, DimC, ..., DimN with the dimensions of the chart.
talk is cheap, supply exceeds demand
- Mark as New
- Bookmark
- Subscribe
- Mute
- Subscribe to RSS Feed
- Permalink
- Report Inappropriate Content
I'm still having issues with it taking forever to load, something the executives won't bother themselves with.
Maybe I can reframe the question - is it possible to allow a user to filter and then export data without it having to load on the screen? I want the end user to play with the visualizations I'm creating after they filter to what they want to see, but is there any way for them to then take the underlying filtered data and export to excel?
- Mark as New
- Bookmark
- Subscribe
- Mute
- Subscribe to RSS Feed
- Permalink
- Report Inappropriate Content
Uhm... did you even try my suggestion?
With an calculation condition the chart will not render until the condition is met. When the condition is met and the chart is rendered it's possible to export the data by right clicking the chart and choosing the Export data option.
talk is cheap, supply exceeds demand
- Mark as New
- Bookmark
- Subscribe
- Mute
- Subscribe to RSS Feed
- Permalink
- Report Inappropriate Content
I did. Sorry, first time I tried it I did it incorrectly. This fixed the issue. I was able to have the chart only display if less than 3 months of data is selected (but the remainder of the report can use more than 3 months.) Appreciate the help.