Unlock a world of possibilities! Login now and discover the exclusive benefits awaiting you.
- Qlik Community
- :
- Forums
- :
- Analytics & AI
- :
- Products & Topics
- :
- App Development
- :
- Filter by last 2 records
- Subscribe to RSS Feed
- Mark Topic as New
- Mark Topic as Read
- Float this Topic for Current User
- Bookmark
- Subscribe
- Mute
- Printer Friendly Page
- Mark as New
- Bookmark
- Subscribe
- Mute
- Subscribe to RSS Feed
- Permalink
- Report Inappropriate Content
Filter by last 2 records
Hello,
I'm trying to make a bar chart that will make the calculation of time per category (lead time) for only the last two orders.
This is my raw data...
| CATEGORY | LEADTIME | FINISH DATE |
| Productos Clientes | 8 | 2015-09-29 00:00:00 |
| Productos Clientes | 6 | 2015-09-29 00:00:00 |
| Productos Clientes | 6 | 2015-09-29 00:00:00 |
| Especiales | 1 | 2015-09-28 00:00:00 |
| Especiales | 5 | 2015-09-27 00:00:00 |
| Productos Clientes | 1 | 2015-09-27 00:00:00 |
| Productos Clientes | 1 | 2015-09-26 00:00:00 |
| Especiales | 1 | 2015-09-26 00:00:00 |
| Productos Clientes | 5 | 2015-09-25 00:00:00 |
and I expect this
CATEGORY AVERAGE(LAST 2 ORDERS)
Productos Clientes 7 ((8+6)/2)
Especiales 3 ((1+5)/2)
And then use this for fill a bar chart, so I think the expression would be in the fx for the measure like a subset filtering of the data (Mysql: Sort and Limit)
Thanks in advance!
- Mark as New
- Bookmark
- Subscribe
- Mute
- Subscribe to RSS Feed
- Permalink
- Report Inappropriate Content
May be create a flag in the script:
Table:
LOAD CATEGORY,
LEADTIME,
Date(Floor(TimeStamp#([FINISH DATE], 'YYYY-MM-DD hh:mm:ss'))) as [FINISH DATE],
RowNo() as SNo;
LOAD * Inline [
CATEGORY, LEADTIME, FINISH DATE
Productos Clientes, 8, 2015-09-29 00:00:00
Productos Clientes, 6, 2015-09-29 00:00:00
Productos Clientes, 6, 2015-09-29 00:00:00
Especiales, 1, 2015-09-28 00:00:00
Especiales, 5, 2015-09-27 00:00:00
Productos Clientes, 1, 2015-09-27 00:00:00
Productos Clientes, 1, 2015-09-26 00:00:00
Especiales, 1, 2015-09-26 00:00:00
Productos Clientes, 5, 2015-09-25 00:00:00
];
Temp:
LOAD CATEGORY,
FirstSortedValue([FINISH DATE], SNo) as [FINISH DATE],
FirstSortedValue(LEADTIME, SNo) as LEADTIME,
FirstSortedValue(SNo, SNo) as SNo,
1 as Flag
Resident Table
Group By CATEGORY;
Concatenate(Temp)
LOAD CATEGORY,
FirstSortedValue([FINISH DATE], SNo, 2) as [FINISH DATE],
FirstSortedValue(LEADTIME, SNo, 2) as LEADTIME,
FirstSortedValue(SNo, SNo, 2) as SNo,
1 as Flag
Resident Table
Group By CATEGORY;
Join(Table)
LOAD *
Resident Temp;
DROP Table Temp;
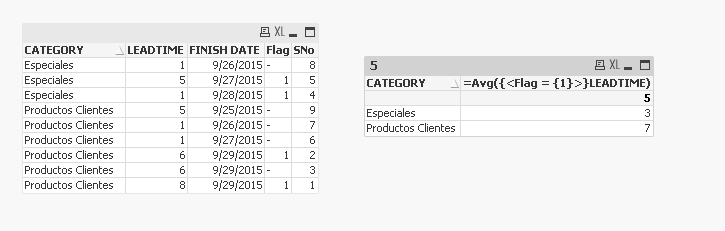
On the front end create a straight table with the following:
Dimension: CATEGORY
Expression: =Avg({<Flag = {1}>}LEADTIME)
Output:
- Mark as New
- Bookmark
- Subscribe
- Mute
- Subscribe to RSS Feed
- Permalink
- Report Inappropriate Content
Thanks Sunny, I really apreciate your answer.
In the end, I managed to work into the dimension expression of a bar-chart, with the whole original table.
Thereby, I used the FirstSortedValue twice for extract the last and before last values and RangeAvg to show their mean measure.
- Mark as New
- Bookmark
- Subscribe
- Mute
- Subscribe to RSS Feed
- Permalink
- Report Inappropriate Content
Awesome 
I am glad I was able to help.
Best,
Sunny