Unlock a world of possibilities! Login now and discover the exclusive benefits awaiting you.
- Qlik Community
- :
- Forums
- :
- Analytics & AI
- :
- Products & Topics
- :
- App Development
- :
- Filtering and comparing two month year
- Subscribe to RSS Feed
- Mark Topic as New
- Mark Topic as Read
- Float this Topic for Current User
- Bookmark
- Subscribe
- Mute
- Printer Friendly Page
- Mark as New
- Bookmark
- Subscribe
- Mute
- Subscribe to RSS Feed
- Permalink
- Report Inappropriate Content
Filtering and comparing two month year
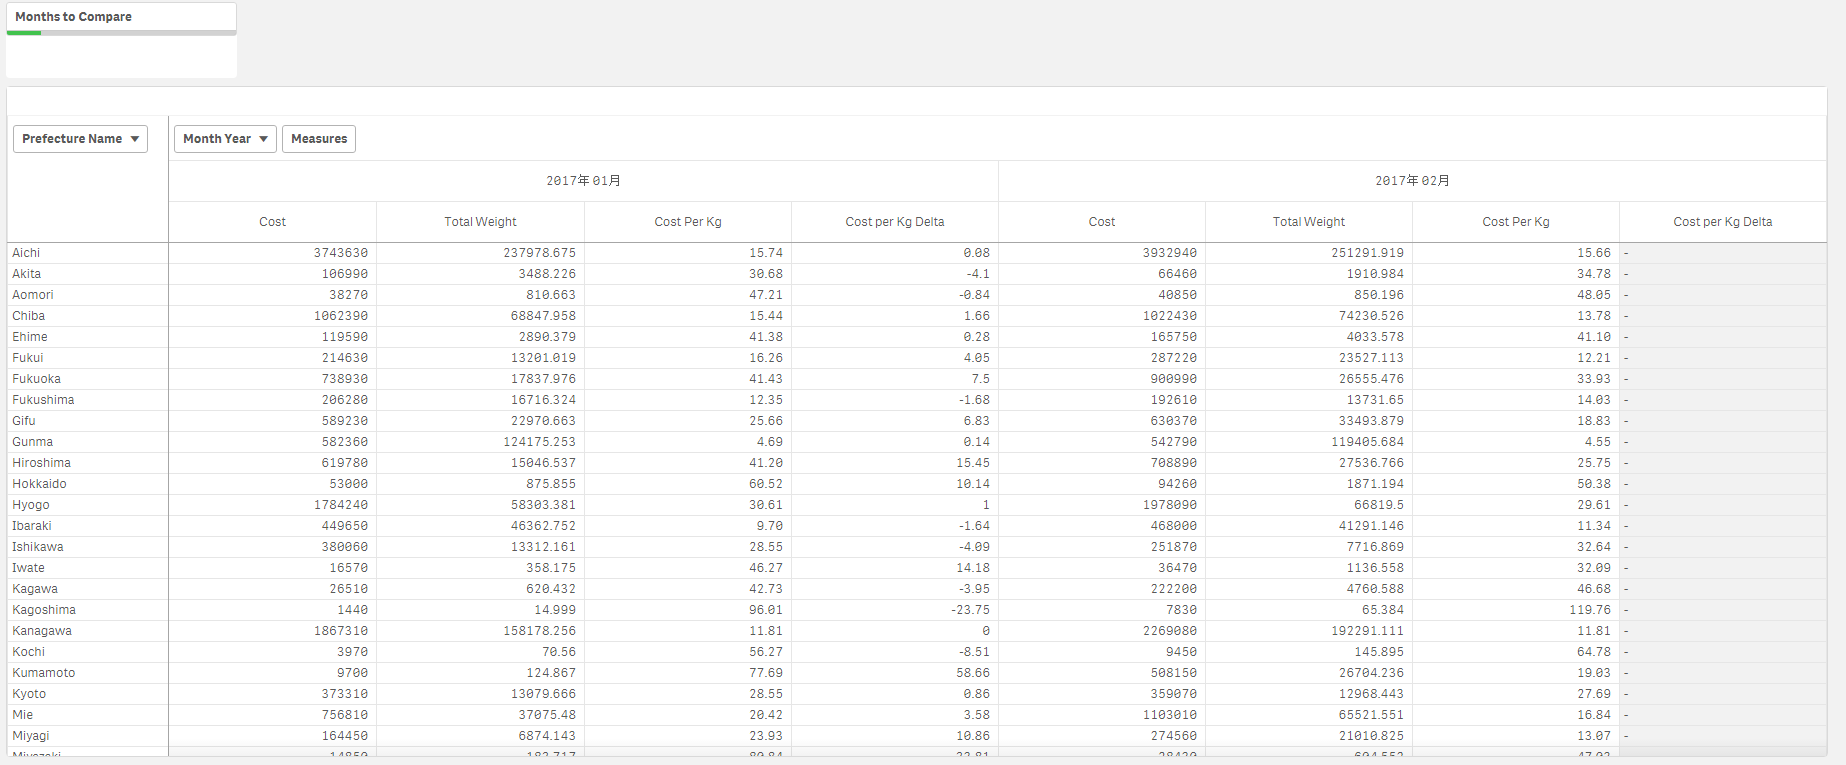
What I want to do here is this, I have 3 years worth of data and what to compare costs in any given month.
How do I get create a calculated column that will be the difference of Cost Per Kg (in the right) - Cost Per Kg (in the left)
So in the example below, I would want have a column there that would be called Cost Per Kg (difference)
Row 1 will then be 15.66-15.74
Could you please help me stalwar1 /swuehl?

Thanks.
- « Previous Replies
-
- 1
- 2
- Next Replies »
Accepted Solutions
- Mark as New
- Bookmark
- Subscribe
- Mute
- Subscribe to RSS Feed
- Permalink
- Report Inappropriate Content
My bad, you need After instead of Before
ceil( Sum([Total Amount])/Sum([Actual Weight]),0.01) - After(ceil( Sum([Total Amount])/Sum([Actual Weight]),0.01))
- Mark as New
- Bookmark
- Subscribe
- Mute
- Subscribe to RSS Feed
- Permalink
- Report Inappropriate Content
May be using Before function
CostPerKgExpression - Before(CostPerKgExpression)
- Mark as New
- Bookmark
- Subscribe
- Mute
- Subscribe to RSS Feed
- Permalink
- Report Inappropriate Content
Thanks for the response. How do I do generate the calculated column in the pivot table?
- Mark as New
- Bookmark
- Subscribe
- Mute
- Subscribe to RSS Feed
- Permalink
- Report Inappropriate Content
Not sure I understand your question?
- Mark as New
- Bookmark
- Subscribe
- Mute
- Subscribe to RSS Feed
- Permalink
- Report Inappropriate Content
I was hoping to create a new column in the pivot like below. Thanks.

- Mark as New
- Bookmark
- Subscribe
- Mute
- Subscribe to RSS Feed
- Permalink
- Report Inappropriate Content
Just add a new measure like this
CostPerKgExpression - Before(CostPerKgExpression)
Make sure to replace the CostPerKgExpression above with the expression you have for CostPerKg..
Does this make sense?
- Mark as New
- Bookmark
- Subscribe
- Mute
- Subscribe to RSS Feed
- Permalink
- Report Inappropriate Content
Cost Per Kg is actually Cost/Weight.
When I added measure of Cost Per Kg Delta with Expression: ceil( Sum([Total Amount])/Sum([Actual Weight]),0.01)-Before(ceil( Sum([Total Amount])/Sum([Actual Weight]),0.01))
The other month would not show up, this is how it looked like

- Mark as New
- Bookmark
- Subscribe
- Mute
- Subscribe to RSS Feed
- Permalink
- Report Inappropriate Content
You still have 2017-02 selected for your chart right?
- Mark as New
- Bookmark
- Subscribe
- Mute
- Subscribe to RSS Feed
- Permalink
- Report Inappropriate Content
Yes. I still have it selected.

- Mark as New
- Bookmark
- Subscribe
- Mute
- Subscribe to RSS Feed
- Permalink
- Report Inappropriate Content
Not sure... would you be able to share a sample?
- « Previous Replies
-
- 1
- 2
- Next Replies »