Unlock a world of possibilities! Login now and discover the exclusive benefits awaiting you.
- Qlik Community
- :
- Forums
- :
- Analytics & AI
- :
- Products & Topics
- :
- App Development
- :
- Re: Get differences for different values in a dime...
- Subscribe to RSS Feed
- Mark Topic as New
- Mark Topic as Read
- Float this Topic for Current User
- Bookmark
- Subscribe
- Mute
- Printer Friendly Page
- Mark as New
- Bookmark
- Subscribe
- Mute
- Subscribe to RSS Feed
- Permalink
- Report Inappropriate Content
Get differences for different values in a dimension compared to one main value in the dimension
Hello!
I am interested to compare the costs per item for different items, regarding their type. Type 0 is my main type or baseline for every item, so all other types of the product should be compared to this type.
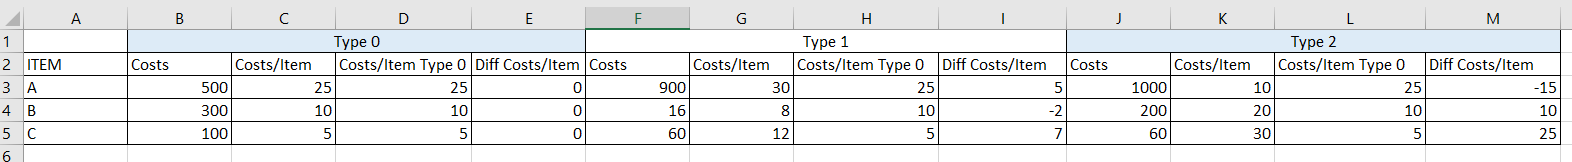
So the result should be a pivot table, which should look like this:
see screenshot
Alternatively it could also be a table that looks like this:
| ITEM | TYPE | Costs | Costs/Item | Costs/Item Type 0 | Diff Costs/Item |
| A | 0 | 500 | 25 | 25 | 0 |
| A | 1 | 900 | 30 | 25 | 5 |
| A | 2 | 1000 | 10 | 25 | -15 |
| B | 0 | 300 | 10 | 10 | 0 |
| B | 1 | 16 | 8 | 10 | -2 |
| B | 2 | 200 | 20 | 10 | 10 |
| C | 0 | 100 | 5 | 5 | 0 |
| C | 1 | 60 | 12 | 5 | 7 |
| C | 2 | 60 | 30 | 5 | 25 |
I tried to use set analysis, e.g. Costs/Item Type 0
sum({$<[TYPE]={'0'}>} [Costs])/sum({$<[TYPE]={'0'}>} [Amount])
, but this is not working. I just get a null value (-) for the columns under an other type, for type 0 it is working. When I set the $ to 1 in my set analysis, I am not able to filter by items anymore.
My formula for the Diff Costs/Item then would be:
(sum(Costs)/sum(Amount))-(sum({$<[TYPE]={'0'}>} [Costs])/sum({$<[TYPE]={'0'}>} [Amount]))
How do i get the formula right?
Thank you very much!
Best regards,
Daniel
Edit: I have attached the pivot table as screenshot, because it was not fully displayed here.
Accepted Solutions
- Mark as New
- Bookmark
- Subscribe
- Mute
- Subscribe to RSS Feed
- Permalink
- Report Inappropriate Content
Perhaps:
sum(total <ITEM> {$<[TYPE]={'0'}>} [Costs])/sum(total <ITEM> {$<[TYPE]={'0'}>} [Amount])
I think that should work for what you're describing
- Mark as New
- Bookmark
- Subscribe
- Mute
- Subscribe to RSS Feed
- Permalink
- Report Inappropriate Content
Perhaps:
sum(total <ITEM> {$<[TYPE]={'0'}>} [Costs])/sum(total <ITEM> {$<[TYPE]={'0'}>} [Amount])
I think that should work for what you're describing
- Mark as New
- Bookmark
- Subscribe
- Mute
- Subscribe to RSS Feed
- Permalink
- Report Inappropriate Content
Thank you, it works perfect. 🙂
The total before the expression was missing.
BR Daniel