Unlock a world of possibilities! Login now and discover the exclusive benefits awaiting you.
- Qlik Community
- :
- Forums
- :
- Analytics & AI
- :
- Products & Topics
- :
- App Development
- :
- Graph Fields after and before a firstsortedvalue d...
- Subscribe to RSS Feed
- Mark Topic as New
- Mark Topic as Read
- Float this Topic for Current User
- Bookmark
- Subscribe
- Mute
- Printer Friendly Page
- Mark as New
- Bookmark
- Subscribe
- Mute
- Subscribe to RSS Feed
- Permalink
- Report Inappropriate Content
Graph Fields after and before a firstsortedvalue date
Hi
My data inputs is like this:
LOAD
device,
Date(fec_recep, 'MM/DD/YYYY hh:mm:ss') as Fecha_recep,
event_name,
List,
SubField(List,'DG') as CODE,
Date(fec_recep, 'MM/DD/YYYY hh:mm:ss') as fechaCODE
FROM [lib://MSG/*.qvd]
(qvd);
Those List is a concatenated list of CODE's and came only in an specific event_name, not all event_names has it. That is why I made a subfield in order to split the list of CODE's
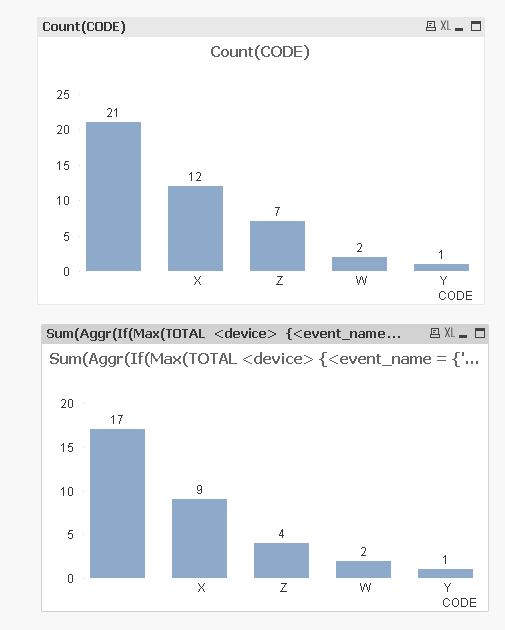
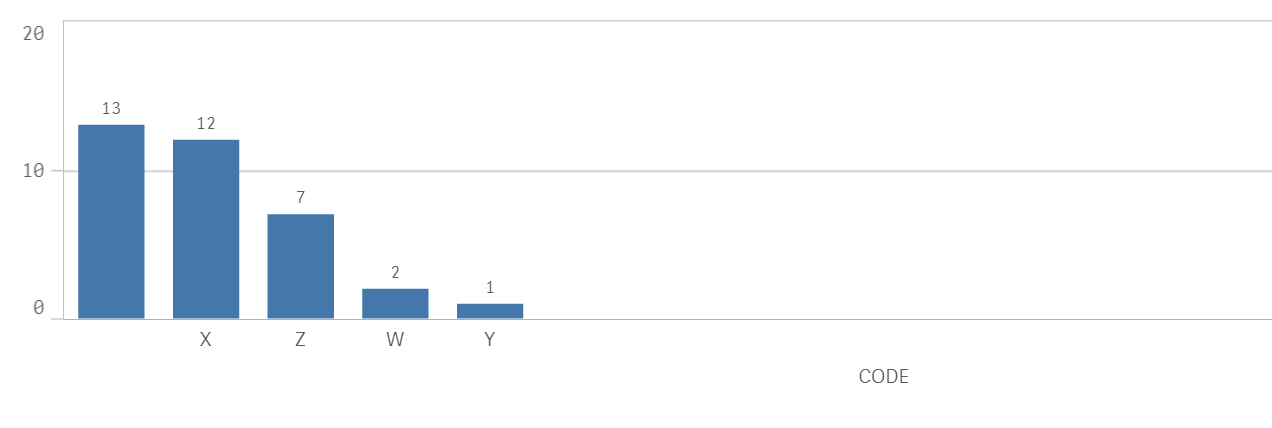
Now I have this graph of the CODE's for an specific device:
in the previous graph:
Dimention: CODE
Measure: Count(CODE)
Now I want to graph the CODE's that were generated (fechaCODE) before the first date of an specific event name of every device:
I tried:
Dimention: CODE
Measure: COUNT(AGGR(if(fechaCODE< FirstSortedValue(AGGR({$<event_name={"*SpecificEvent*"}>} Fecha_recep,device),Fecha_recep,1),CODE),CODE))
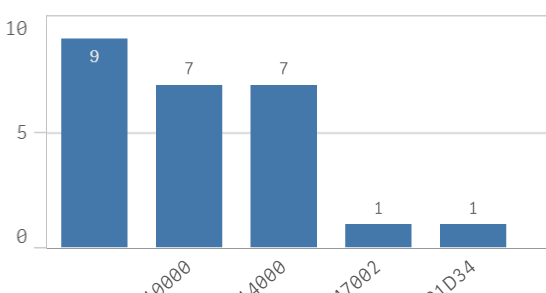
Then I tried to make the same graph but with those CODE's created just before FirstSortedValue(AGGR({$<event_name={"*SpecificEvent*"}>} Fecha_recep,device),Fecha_recep,1).
If I make a table of CODE and FirstSortedValue(AGGR({$<event_name={"*SpecificEvent*"}>} Fecha_recep,device),Fecha_recep,1), IT WORKS:
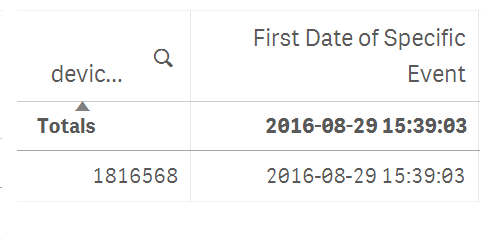
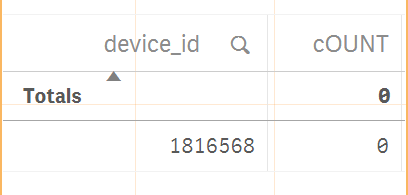
And I want just to count the CODE's in order to test the Measure and does not works:
Count is: count(aggr(If(fechaCODE< firstsortedvalue({$<event_name={"*Specific Event*"}>} Fecha_recep , Fecha_recep,1), fechaCODE),device,CODE))
Here is an input data example:
| device | event_name | List | fec_recep |
| serial1 | Event1 | DGXDGYDGZ | 01-01-16 |
| serial1 | Event2 | 02-01-16 | |
| serial1 | Event2 | 03-01-16 | |
| serial1 | Event2 | 04-01-16 | |
| serial1 | Event1 | DGXDGZ | 05-01-16 |
| serial1 | Event1 | DGXDGZ | 06-01-16 |
| serial2 | Event1 | DGXDGZ | 02-01-16 |
| serial2 | Event1 | DGXDGZDGW | 03-01-16 |
| serial2 | Event1 | DGXDGZDGW | 04-01-16 |
| serial2 | Event2 | 05-01-16 | |
| serial2 | Event2 | 06-01-16 | |
| serial3 | Event1 | DGX | 05-01-16 |
| serial3 | Event1 | DGX | 06-01-16 |
| serial3 | Event1 | DGX | 07-01-16 |
| serial3 | Event1 | DGX | 08-01-16 |
| serial3 | Event1 | DGX | 09-01-16 |
| serial4 | Event2 | 17-01-16 | |
| serial4 | Event2 | 18-01-16 | |
| serial4 | Event2 | 19-01-16 | |
| serial4 | Event1 | DGZ | 20-01-16 |
| serial4 | Event1 | DGX | 21-01-16 |
I load the data like this because "list" has the Codes concatenated:
LOAD
device,
event_name,
List,
Date(fec_recep, 'MM/DD/YYYY hh:mm:ss') as Fecha_recep,
SubField(List,'DG') as CODE,
Date(fec_recep, 'MM/DD/YYYY hh:mm:ss') as fechaCODE
FROM [lib://test/data.xlsx]
(ooxml, embedded labels, table is Sheet1);
I could make this graph with
Dimention: CODE
Measurement: COUNT(CODE)
now I want to count only the CODEs that were generated before the oldest Event 2 date,
The graph I need:
I tried: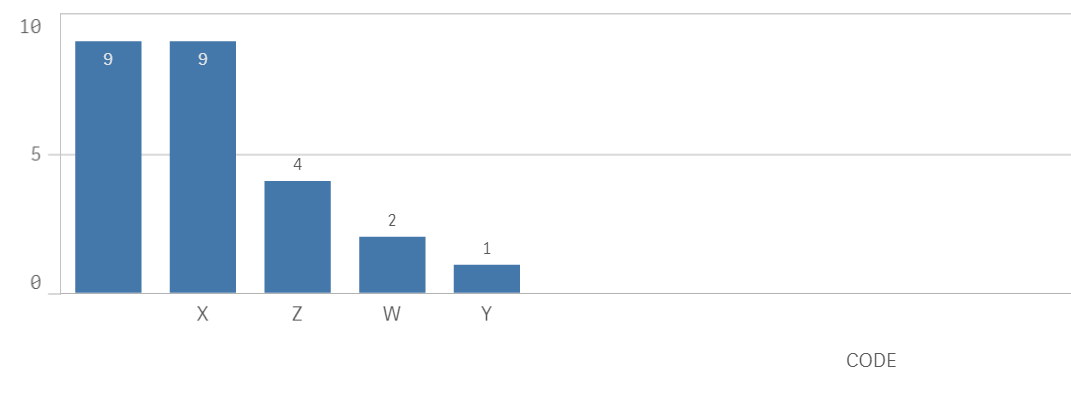
Dimention: CODE
Measure: COUNT(AGGR(if(fechaCODE< FirstSortedValue(AGGR({$<event_name={"Event2"}>} Fecha_recep,device),Fecha_recep,1),CODE),CODE))
Message was edited by: JUAN villalva
- Mark as New
- Bookmark
- Subscribe
- Mute
- Subscribe to RSS Feed
- Permalink
- Report Inappropriate Content
I am not entirely sure what you are trying to get. Would you be able to share a sample with the expected output to help you better?
- Mark as New
- Bookmark
- Subscribe
- Mute
- Subscribe to RSS Feed
- Permalink
- Report Inappropriate Content
hi, thanks for the replay. I edited and added more info above
- Mark as New
- Bookmark
- Subscribe
- Mute
- Subscribe to RSS Feed
- Permalink
- Report Inappropriate Content
May be try this:
Sum(Aggr(If(Max(TOTAL <device> {<event_name = {'Event2'}>} Fecha_recep)>= Fecha_recep or Len(Trim(Max(TOTAL <device> {<event_name = {'Event2'}>} Fecha_recep))) = 0, 1, 0), device, event_name, CODE, Fecha_recep))