Unlock a world of possibilities! Login now and discover the exclusive benefits awaiting you.
- Qlik Community
- :
- Forums
- :
- Analytics & AI
- :
- Products & Topics
- :
- App Development
- :
- Grouping dimensions by ranked measure
- Subscribe to RSS Feed
- Mark Topic as New
- Mark Topic as Read
- Float this Topic for Current User
- Bookmark
- Subscribe
- Mute
- Printer Friendly Page
- Mark as New
- Bookmark
- Subscribe
- Mute
- Subscribe to RSS Feed
- Permalink
- Report Inappropriate Content
Grouping dimensions by ranked measure
All,
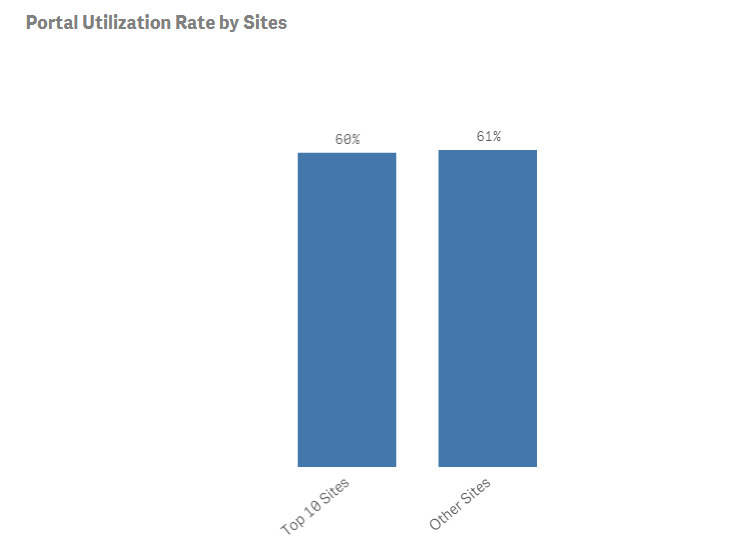
I am trying to make a simple bar chart that has one dimension, "Top 10 Sites", which averages the top ten sites by measure (utilization rate), and then have another date point that would include all sites outside the Top 10 by Utilization rate. I would assume it would be an aggr(if(rank(avg))) or something along those lines.. Any input? see visual I'm trying to derive below.
- Tags:
- rank and aggr
Accepted Solutions
- Mark as New
- Bookmark
- Subscribe
- Mute
- Subscribe to RSS Feed
- Permalink
- Report Inappropriate Content
hi
you are correct
your dimension should be
aggr(if(rank(avg(utilization rate))<=10,'Top 10','Other Sites'),Site)
- Mark as New
- Bookmark
- Subscribe
- Mute
- Subscribe to RSS Feed
- Permalink
- Report Inappropriate Content
hi
you are correct
your dimension should be
aggr(if(rank(avg(utilization rate))<=10,'Top 10','Other Sites'),Site)
- Mark as New
- Bookmark
- Subscribe
- Mute
- Subscribe to RSS Feed
- Permalink
- Report Inappropriate Content
Create a bar chart without dimension
Use below two expressions
SUM({<Site = {"=Rank(Avg(Sales),4)<=10"}>}Sales)
SUM({<Site = {"=Rank(Avg(Sales),4)>10"}>}Sales)
Change Sales field with your respective measure field..