Unlock a world of possibilities! Login now and discover the exclusive benefits awaiting you.
- Qlik Community
- :
- Forums
- :
- Analytics & AI
- :
- Products & Topics
- :
- App Development
- :
- Help needed: correct year/month display of cumulat...
- Subscribe to RSS Feed
- Mark Topic as New
- Mark Topic as Read
- Float this Topic for Current User
- Bookmark
- Subscribe
- Mute
- Printer Friendly Page
- Mark as New
- Bookmark
- Subscribe
- Mute
- Subscribe to RSS Feed
- Permalink
- Report Inappropriate Content
Help needed: correct year/month display of cumulative line charts
Hello Qlik Community,
I’m a Qlik newbie, with only 2 months of Qlik Sense experience, and I can't solve the following problem, I really hope you can help me out here.
I’m sure that this is a problem that is rather easy to solve for seasoned experts, so forgive me if I ask something trivial.
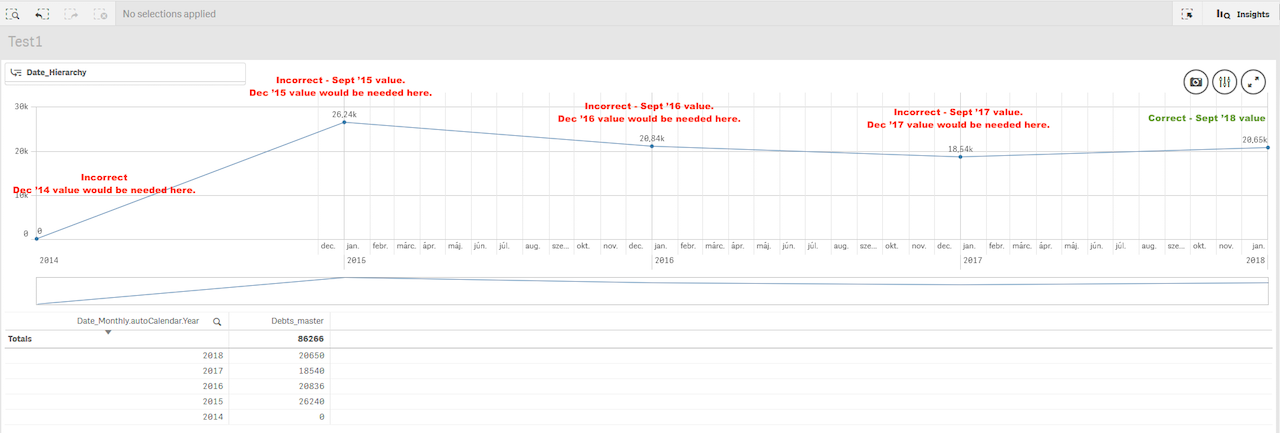
I have a monthly time series (from Dec 2014 to Sept 2018) having one cumulative value (debt) for each month.
I have to display a line chart with a yearly view as the default, and then make it possible to drill down to a monthly view.
This would be trivial with monthly data, but here we have cumulative monthly data, so in the yearly view, I’d like to show only the last value of a given year, so the value for Dec 2014, Dec 2015, Dec 2016, Dec 2017, and then Sept 2018.
And then, when I click on a datapoint in the yearly line chart, I’d like to get into the monthly view, so for example clicking on 2018, I’d get a linechart with monthly data from Jan 2018 to Sept 2018. When I click on 2017, I’d get data from Jan 2017 to Dec 2017, etc.
This is the calculation I’m using at this point:
if(GetSelectedCount([Date_Monthly.autoCalendar.Year]) = 0,
sum({<[Date_Monthly.autoCalendar.Month]={'$(=Month(DATE(Max(Date_Monthly))))'}>}[Debts]),
sum([Debts]) )
The problem is that the yearly view shows the Sept data for each year, so with this calculation, I get Sept 2014, Sept 2015, Sept 2016, Sept 2017, and Sept 2018 instead of Dec 2014, Dec 2015, Dec 2016, Dec 2017, and Sept 2018...
Can you help me with the above calculation so I get the correct results?
I also attached the app with the data and the current (wrong) solution.
Many thanks,
György
Accepted Solutions
- Mark as New
- Bookmark
- Subscribe
- Mute
- Subscribe to RSS Feed
- Permalink
- Report Inappropriate Content
Try this
If(GetSelectedCount([Date_Monthly.autoCalendar.Year]) = 0
,FirstSortedValue(Aggr(Sum([Debts]), [Date_Monthly.autoCalendar.Month], [Date_Monthly.autoCalendar.Year]), -Aggr([Date_Monthly.autoCalendar.Month], [Date_Monthly.autoCalendar.Month], [Date_Monthly.autoCalendar.Year]))
,Sum([Debts])
)
- Mark as New
- Bookmark
- Subscribe
- Mute
- Subscribe to RSS Feed
- Permalink
- Report Inappropriate Content
Hello Sunny,
wow that was fast.
I really appreciate your help, now my line chart works as it should.
Many thanks,
György
- Mark as New
- Bookmark
- Subscribe
- Mute
- Subscribe to RSS Feed
- Permalink
- Report Inappropriate Content
Super, I am glad I was able to help 