Unlock a world of possibilities! Login now and discover the exclusive benefits awaiting you.
- Qlik Community
- :
- Forums
- :
- Analytics & AI
- :
- Products & Topics
- :
- App Development
- :
- How to Custom Drilldown Labels
- Subscribe to RSS Feed
- Mark Topic as New
- Mark Topic as Read
- Float this Topic for Current User
- Bookmark
- Subscribe
- Mute
- Printer Friendly Page
- Mark as New
- Bookmark
- Subscribe
- Mute
- Subscribe to RSS Feed
- Permalink
- Report Inappropriate Content
How to Custom Drilldown Labels
Hi
I've created a drill down with Calculated Dimensions, How Can I customize the label for each Dimension inside drill down?
For Instance:
Data load :
CONTRABAND:
LOAD * INLINE [
Name,Quantity
CellPhone,10
CellPhone,20
Cellphone Charger,50
SIM Card, 10
COCAINE, 5
ECSTACY, 10
HEROINE, 2
MARIJUANA,3
];
Drill down :

when I use the drill down in the Bar chart : the Title of X-axis and Legend show the formula , How can I change the labels ?
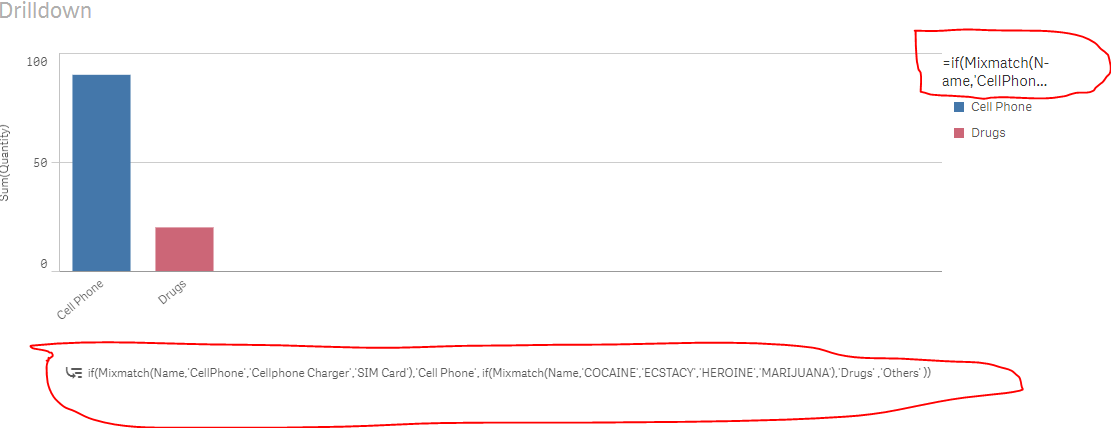
thanks! !
- Mark as New
- Bookmark
- Subscribe
- Mute
- Subscribe to RSS Feed
- Permalink
- Report Inappropriate Content
Why don't you create the new field in the script?
CONTRABAND:
LOAD * INLINE [
Name,Quantity
CellPhone,10
CellPhone,20
Cellphone Charger,50
SIM Card, 10
COCAINE, 5
ECSTACY, 10
HEROINE, 2
MARIJUANA,3
];
LinkTable:
LOAD Name,
if(Mixmatch(Name,'CellPhone','Cellphone Charger','SIM Card'),'Cell Phone',
if(Mixmatch(Name,'COCAINE','ECSTACY','HEROINE','MARIJUANA'),'Drugs'
,'Others')) as Category
Resident CONTRABAND;
And now you can use Category as a dimension instead of using the If(MixMatch(...)
- Mark as New
- Bookmark
- Subscribe
- Mute
- Subscribe to RSS Feed
- Permalink
- Report Inappropriate Content
Hi
Thanks for your quickly response .
to create a new filed in LOAD Scripts is a great workaround for this issue,
but I am looking forward a new way for users to create group when they create their own dimensions.
For Instance, By Age group ,some users use 10 years age group, some might use 5 years age group ,or someone else will use under 17 as Juvenile, and for those older than 17 will use 5 years age group.
- Mark as New
- Bookmark
- Subscribe
- Mute
- Subscribe to RSS Feed
- Permalink
- Report Inappropriate Content
you can refer below link to get idea but not sure if it works in Qlik Sense also.
- Mark as New
- Bookmark
- Subscribe
- Mute
- Subscribe to RSS Feed
- Permalink
- Report Inappropriate Content