Unlock a world of possibilities! Login now and discover the exclusive benefits awaiting you.
- Qlik Community
- :
- Forums
- :
- Analytics
- :
- App Development
- :
- How to get filters to work with a crosstable elect...
- Subscribe to RSS Feed
- Mark Topic as New
- Mark Topic as Read
- Float this Topic for Current User
- Bookmark
- Subscribe
- Mute
- Printer Friendly Page
- Mark as New
- Bookmark
- Subscribe
- Mute
- Subscribe to RSS Feed
- Permalink
- Report Inappropriate Content
How to get filters to work with a crosstable election?
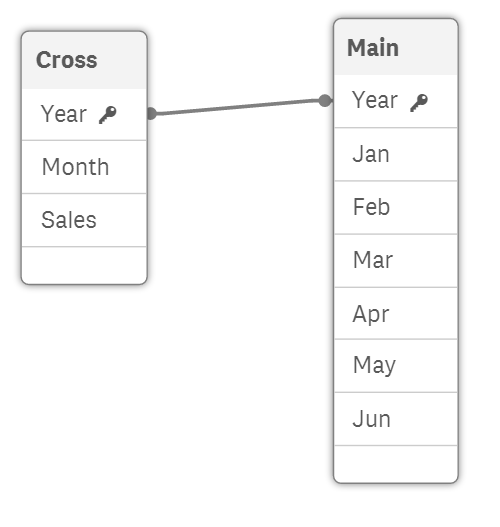
Using the example table found here Working with crosstables in the data load script ‒ Qlik Sense where we have the LOAD statements as
Main:
LOAD
"Year",
Jan,
Feb,
Mar,
Apr,
May,
Jun
FROM [lib://Desktop/cross.xlsx]
(ooxml, embedded labels, table is Sheet1);
Cross:
crosstable (Month, Sales) LOAD * Resident Main;
If I create a pie chart using 'Month' as the Dimension and Sum('Sales') as the Measure then try to select a filter from that pie chart, the other charts that are not using data from the pie chart do not update. However, selections from other charts (such as a bar chart with 'Year' as the Dimension and sum('Apr') as the Measure) properly update the pie chart. Any insight as to why?
- Mark as New
- Bookmark
- Subscribe
- Mute
- Subscribe to RSS Feed
- Permalink
- Report Inappropriate Content
Hi,
Could you show the data model? Maybe the name of the fields are wrong.
- Mark as New
- Bookmark
- Subscribe
- Mute
- Subscribe to RSS Feed
- Permalink
- Report Inappropriate Content
Sure thing