Unlock a world of possibilities! Login now and discover the exclusive benefits awaiting you.
- Qlik Community
- :
- Forums
- :
- Analytics & AI
- :
- Products & Topics
- :
- App Development
- :
- How to get the difference of two dates in a pivot ...
- Subscribe to RSS Feed
- Mark Topic as New
- Mark Topic as Read
- Float this Topic for Current User
- Bookmark
- Subscribe
- Mute
- Printer Friendly Page
- Mark as New
- Bookmark
- Subscribe
- Mute
- Subscribe to RSS Feed
- Permalink
- Report Inappropriate Content
How to get the difference of two dates in a pivot table
Hello,
I'm quite new to Qlik, hope someone can help me out with my current challenges.
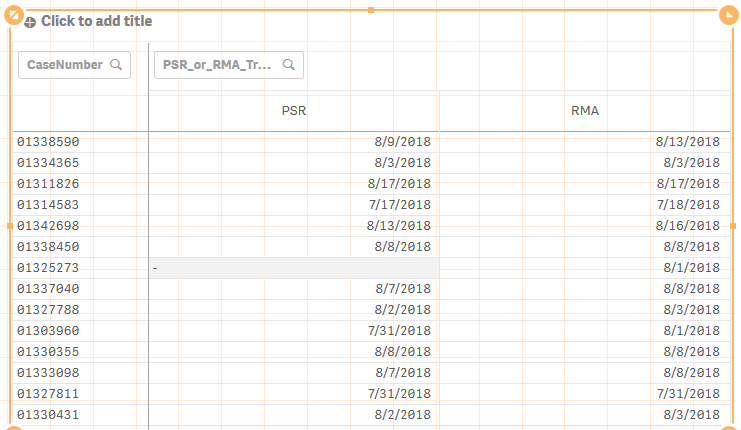
I have here a pivot table and want to have another column reflecting the difference between "RMA" dates and "PSR" dates (RMA-PSR).
Will greatly appreciate your help.
Thank you so much in advance!
- Mark as New
- Bookmark
- Subscribe
- Mute
- Subscribe to RSS Feed
- Permalink
- Report Inappropriate Content
You can turn on totals for the PSR_OR_RMA_Tr dimension so you get a totals column.
Change the label for the totals column to "# Days".
Then you will have to change your measure to something similar to this:
If( ColumnNo()=0 , Max(PSR_or_RMA_Tr)-Min(PSR_or_RMA_Tr) , PSR_or_RMA_Tr )
- Mark as New
- Bookmark
- Subscribe
- Mute
- Subscribe to RSS Feed
- Permalink
- Report Inappropriate Content
Thank you so much for the response, Peter!
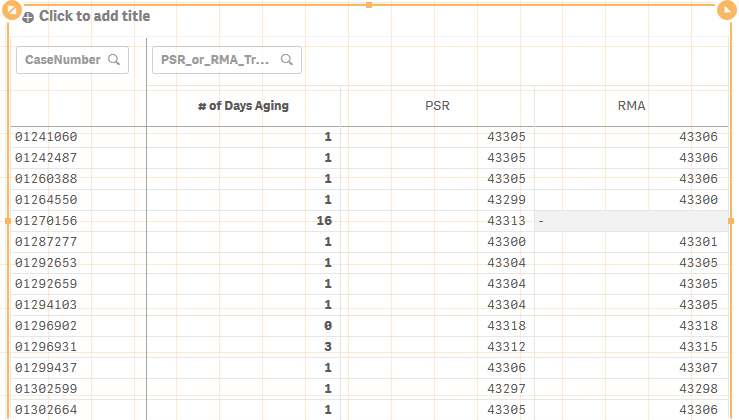
It worked! I just did a minor adjustment in the measurement. Doing something like this:
if(columnNo()=0, Max([CreatedDate.autoCalendar.Date])-Min([CreatedDate.autoCalendar.Date]),[CreatedDate.autoCalendar.Date])
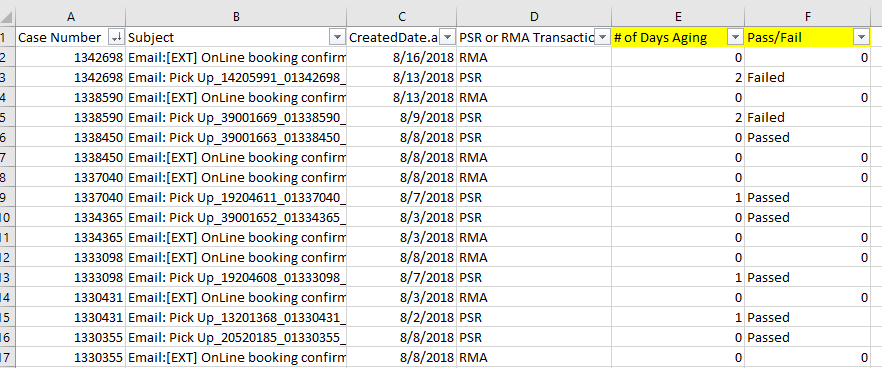
Now, below table will appear:
Additional queries:
1. Is there a way to change the date format to (dd/mm/yyyy)?
- I've tried to change the number formatting to 'Dates', but the '# of Days Aging' column follows.
2. Would like to add another column with following measures If '# of Days Aging' <=1, "Passed", "Failed"
Again, thank you so much!
Rael
- Mark as New
- Bookmark
- Subscribe
- Mute
- Subscribe to RSS Feed
- Permalink
- Report Inappropriate Content
1) Yes you can add the date formatting by using the Date()-function like this:
If( ColumnNo()=0, Max([CreatedDate.autoCalendar.Date])-Min([CreatedDate.autoCalendar.Date]), Date([CreatedDate.autoCalendar.Date],'DD/MM/YYYY'))
2) Unfortunately you can't have more than one single total column. But you could combine the number with the text "Passed" or "Failed" like this:
If( ColumnNo()=0, If( Max([CreatedDate.autoCalendar.Date])-Min([CreatedDate.autoCalendar.Date])<=1; 'Passed ','Failded ') & (Max([CreatedDate.autoCalendar.Date])-Min([CreatedDate.autoCalendar.Date])), Date([CreatedDate.autoCalendar.Date],'DD/MM/YYYY'))
- Mark as New
- Bookmark
- Subscribe
- Mute
- Subscribe to RSS Feed
- Permalink
- Report Inappropriate Content
Thanks again Peter!
I've tried to experiment a little, separating two measures the one with "Passed or Failed" and with the one calculating the difference and here's what I've got:
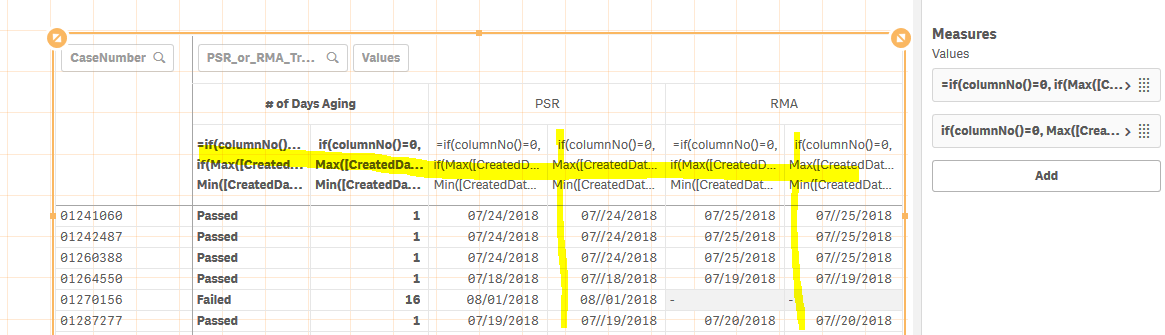
> Thought that the other columns created for "PSR" and "RMA" are subtotals? is there a way or somehow hide it?
> Then the header showing the expressions hope there's a way that we can hide it as well.
Thank you so much!
- Mark as New
- Bookmark
- Subscribe
- Mute
- Subscribe to RSS Feed
- Permalink
- Report Inappropriate Content
No there is not - unless you want to implement a more complicated approach to add two place holders in the PSR_RMA_Tr field that comes in addition to PSR and RMA in the datamodel In addition you will have to populate rows for all the dates with NULL values for both of the new field values in PSR_RMA_Tr field.
That's why I pointed out that you will have to do with a single totals column for a straightforward approach.
Why can't a single column like this be a solution for you:
# of Days Aging:
1 - Passed
1 - Passed
16 - Failed
You could even make a Dual-value out of it like this and get it right aligned:
Dual(
If( (Max([CreatedDate.autoCalendar.Date])-Min([CreatedDate.autoCalendar.Date]) & ' - ' Max([CreatedDate.autoCalendar.Date])-Min([CreatedDate.autoCalendar.Date])<=1; 'Passed ','Failed ') )
,
Max([CreatedDate.autoCalendar.Date])-Min([CreatedDate.autoCalendar.Date])
)
NOTE: see my last remark underneath on not using a Pivot Table at all
- Mark as New
- Bookmark
- Subscribe
- Mute
- Subscribe to RSS Feed
- Permalink
- Report Inappropriate Content
I am not sure if you really need a pivot table for this at all. If you always have two columns and you want the flexibility to have more than one total it is much much easier to use a (straight) table.
I see a lot of overuse and misuse of the Pivot Table because people believe that this is the best table visualization in Qlik Sense.
If you have a static number of columns for your data. If you don't need collapse and expand of hierachies between dimensions row-wise or column-wise I find the (straight) table much better.
Using simple set expressions you filter the relevant data for each column.
- Mark as New
- Bookmark
- Subscribe
- Mute
- Subscribe to RSS Feed
- Permalink
- Report Inappropriate Content
Thank you so much Petter. Like I said, I'm kinda new to this analytics platform so, I really appreciate all your help and inputs.
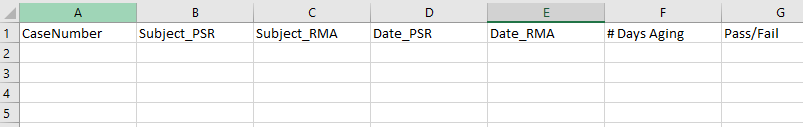
Here's what I have in my (straight) Table:
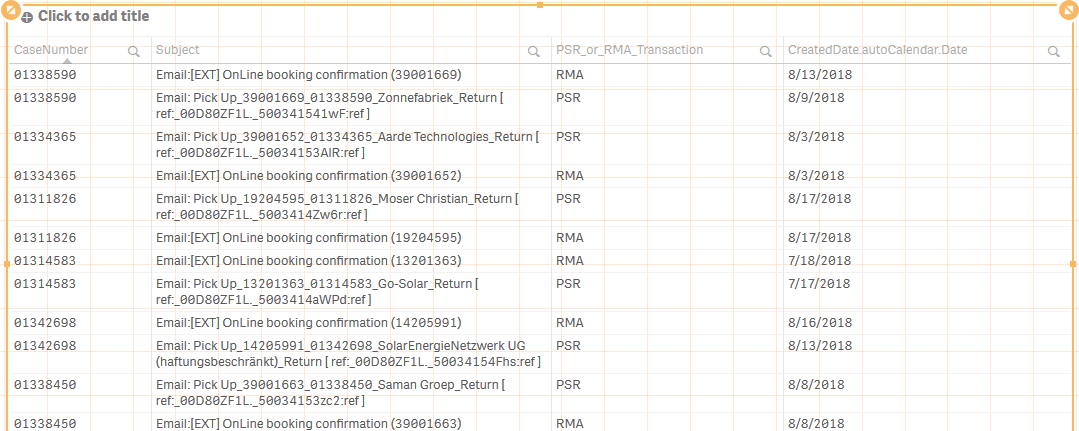
Could it be possible to have something like the below, adding two new columns using LOAD or in Expressions?
> Logic would be:
1. # of Days Aging
if "Case Number" is equals then if "PSR or RMA Transaction" = 'RMA' = 0 Otherwise (PSR),
(RMA&CreatedDate - PSR&CreatedDate)
2. Pass/Fail - If <=1, Passed, Failed
3. Then eventually I will be showing "PSR" only details
4. Or is there any possibility to show other scenario such as this: Splitting the "Subject" and "CreatedDates" to RMA and PSR then getting the Aging days and Pass/Fail?
My apology cause I really can't go things going on my own having only limited knowledge and resources.
Thank you so much for any help!
Regards