Unlock a world of possibilities! Login now and discover the exclusive benefits awaiting you.

Announcements
Q&A with Qlik - Qlik Cloud Migration: Questions about migrating to Qlik Cloud? Catch the latest replay!
- Qlik Community
- :
- Forums
- :
- Analytics & AI
- :
- Products & Topics
- :
- App Development
- :
- Inputting percentages into Bar Chart (Qlik Sense)
Options
- Subscribe to RSS Feed
- Mark Topic as New
- Mark Topic as Read
- Float this Topic for Current User
- Bookmark
- Subscribe
- Mute
- Printer Friendly Page
Turn on suggestions
Auto-suggest helps you quickly narrow down your search results by suggesting possible matches as you type.
Showing results for

Not applicable
2015-10-05
04:07 AM
- Mark as New
- Bookmark
- Subscribe
- Mute
- Subscribe to RSS Feed
- Permalink
- Report Inappropriate Content
Inputting percentages into Bar Chart (Qlik Sense)
I have created a bar chart and i would like to know how i can show the value in percentage. The value i have are all number derived from count.Please Help!!!!!!
533 Views
1 Reply

.png "Former Employee") JonnyPoole
JonnyPoole
Former Employee
2015-10-05
09:07 AM
- Mark as New
- Bookmark
- Subscribe
- Mute
- Subscribe to RSS Feed
- Permalink
- Report Inappropriate Content
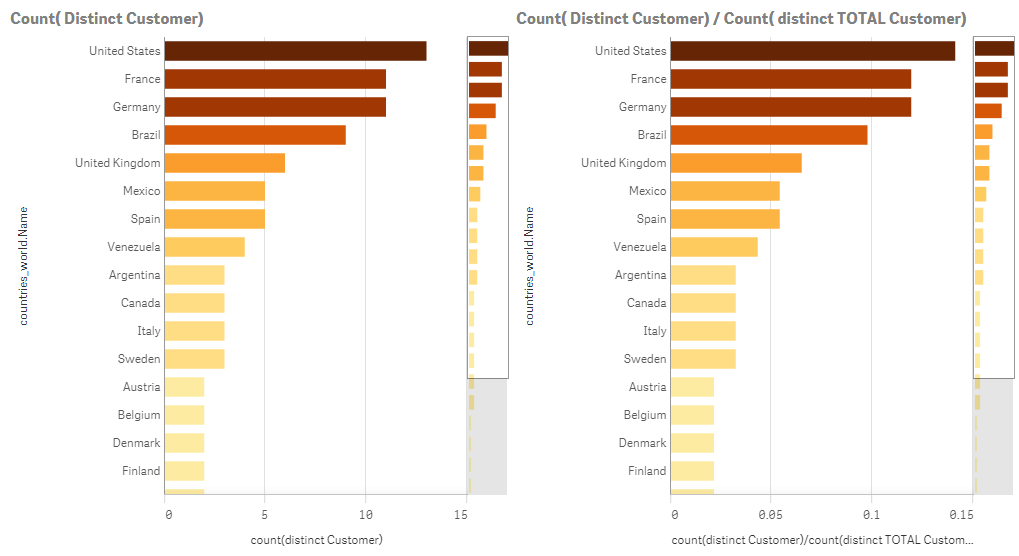
If you have a measure like: Count( Distinct Customer)
You can make it a percent by a division against the total:
Count ( Distinct Customer) / Count ( Distinct TOTAL Customer)
The TOTAL parameter will yield the count across all the dimension values, not just the individuals
Not shown below, but you could easily chance the format of the measure to be a number -> %
406 Views