Unlock a world of possibilities! Login now and discover the exclusive benefits awaiting you.
- Qlik Community
- :
- Forums
- :
- Analytics & AI
- :
- Products & Topics
- :
- App Development
- :
- Issue with Pivot table in Qlik Sense
- Subscribe to RSS Feed
- Mark Topic as New
- Mark Topic as Read
- Float this Topic for Current User
- Bookmark
- Subscribe
- Mute
- Printer Friendly Page
- Mark as New
- Bookmark
- Subscribe
- Mute
- Subscribe to RSS Feed
- Permalink
- Report Inappropriate Content
Issue with Pivot table in Qlik Sense
Hi All,
I am building a pivot table in Qliksense for zonewise number of registrations and target registrations for a bank. In dimensions, I have a zone column and a date column. For measure, I have new number of registrations. So the data shown is new registrations per day per zone.
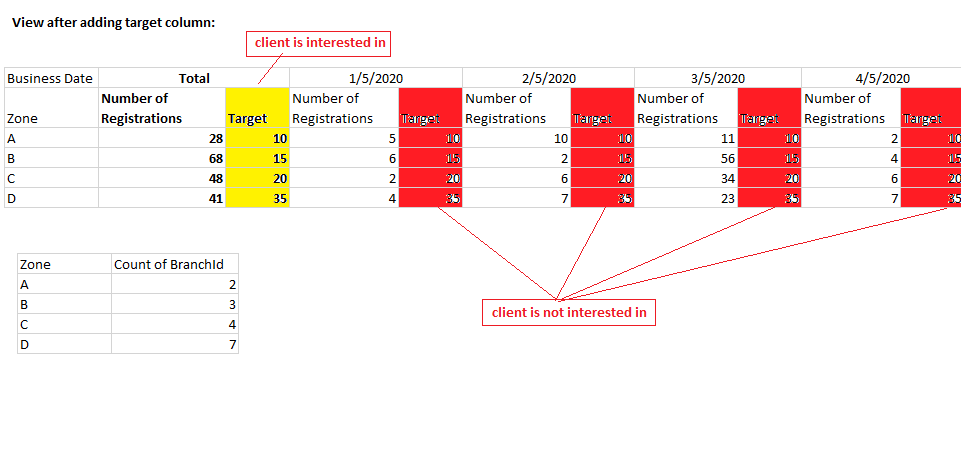
My client is basically interested in the total column that comes up at the beginning. So it shows sum of zone wise registrations for all the dates, depicted in image 1.
Now the new metric that I want to add is, target registrations which is calculated as:
5*count(distinct branch_id)
As the grain of both the metric calculations is not same, I get the same target for all dates and the total column which is not correct(illustrated in image 2).
My client is only interested in the totals section and does not want to see the individual day wise target(as the value is wrong). This is illustrated in image 3. For this, I removed the 2nd expression and tried adding it as a calculated dimension but it did not work.
Can someone help in meeting this requirement?
Thanks
- Mark as New
- Bookmark
- Subscribe
- Mute
- Subscribe to RSS Feed
- Permalink
- Report Inappropriate Content
I'm fairly sure you were headed in the right direction when you tried creating a calculated dimension, but you probably need to wrap it in an AGGR() to make it work:
5*Aggr(count(distinct branch_id),Zone)
- Mark as New
- Bookmark
- Subscribe
- Mute
- Subscribe to RSS Feed
- Permalink
- Report Inappropriate Content
Hello,
I think you can work this out with the content from this post:
I have never tried but it appears to be somewhat similar.